Bollinger Bands strategies are a popular tool among traders and investors for analyzing market trends and making profitable trading decisions. As a trader, you have found Bollinger Bands to be an invaluable resource in your trading arsenal.
Bollinger Bands Strategies for Traders
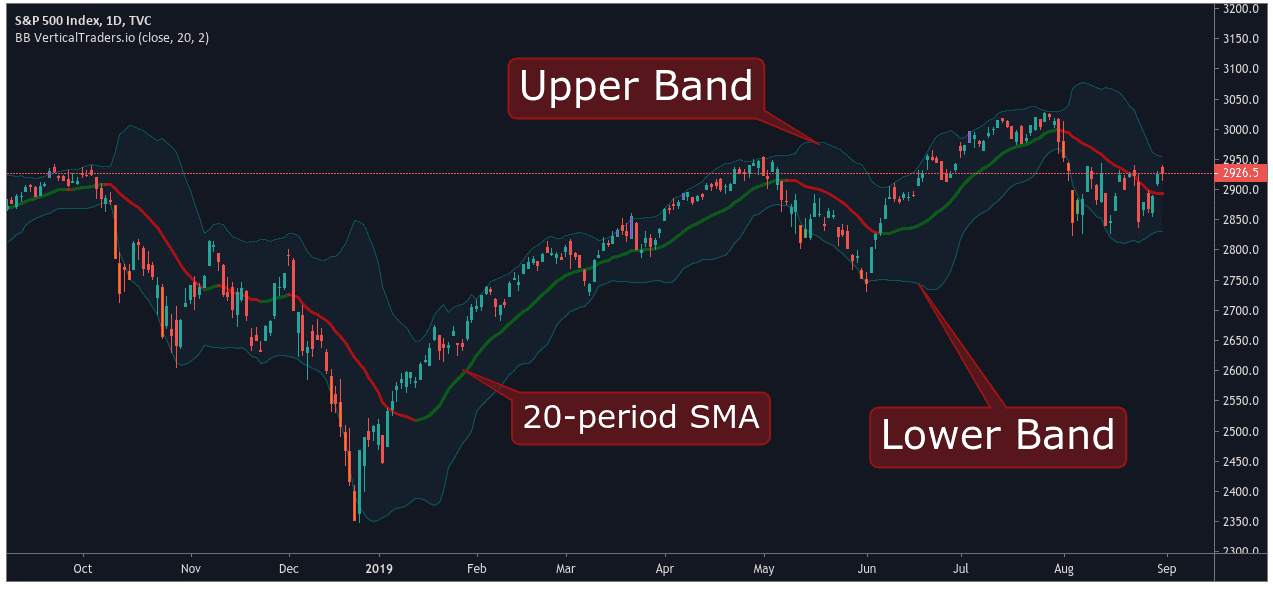
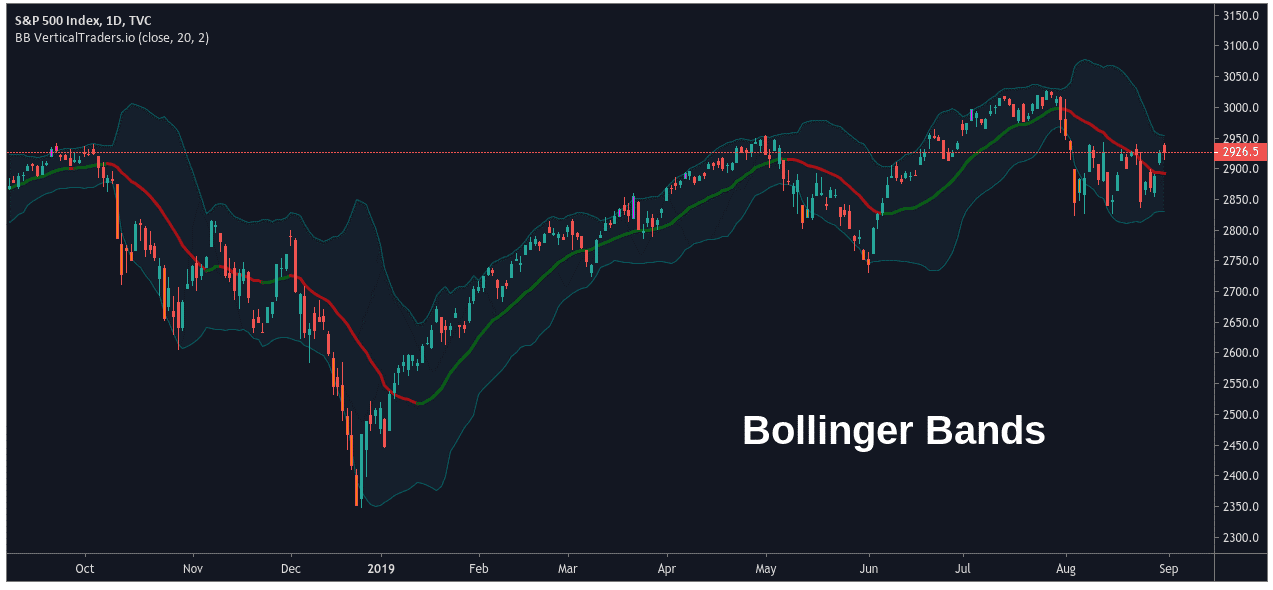
In the world of finance, Bollinger Bands Strategies consist of three lines: a simple moving average (SMA) line in the middle, and two standard deviation lines above and below it. These bands help you determine the volatility and potential price movements of a particular asset or security.
In this article, Forex Prop Reviews will share some effective strategies on how to utilize Bollinger Bands for successful trading outcomes.
What Are Bollinger Bands?
Bollinger Bands are like a dynamic fence that encloses stock prices, with the outer bands acting as boundaries and the middle band serving as a guiding path. These bands were developed by John Bollinger in the 1980s and have become widely used in technical analysis strategies.
The upper band is calculated by adding two standard deviations to the moving average of stock prices, while the lower band is calculated by subtracting two standard deviations. This creates a channel that represents normal price fluctuations.
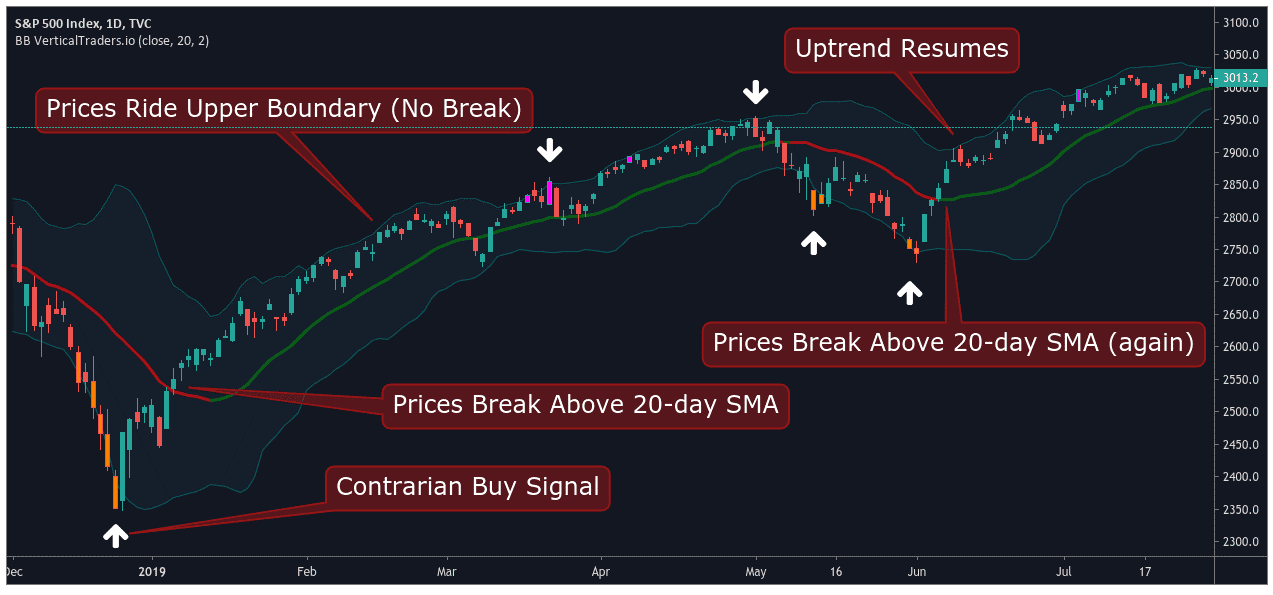
Traders use Bollinger Bands to determine potential buy or sell signals. When stock prices touch or cross above the upper band, it may indicate an overbought condition, suggesting it could be a good time to sell. Conversely, when prices touch or cross below the lower band, it may suggest an oversold condition and could be a buying opportunity.
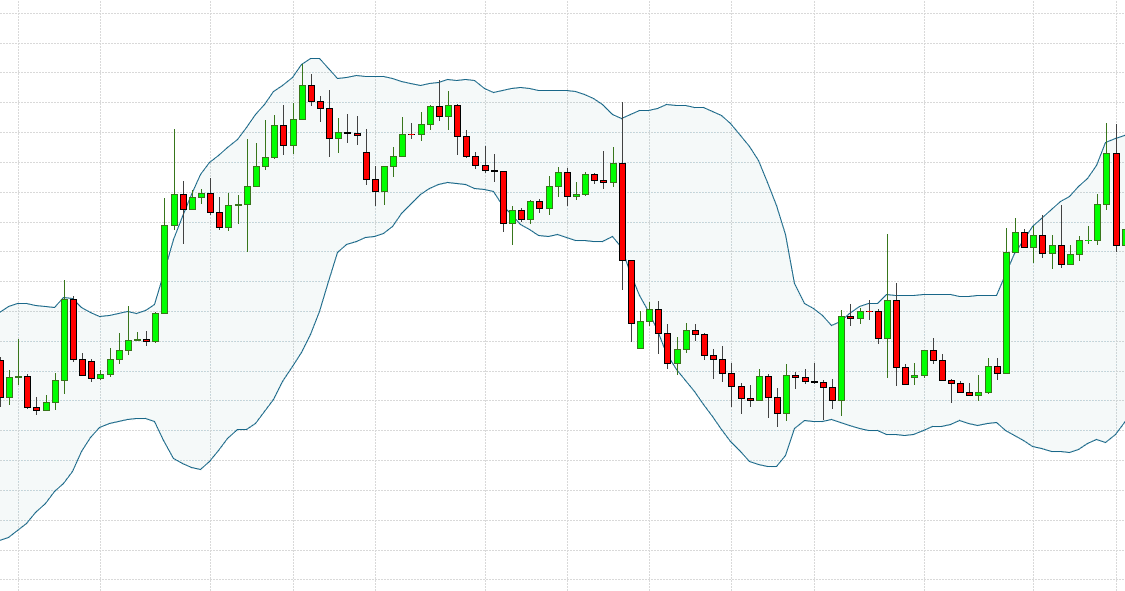
Additionally, traders analyze how wide or narrow the bands are to gauge market volatility. Narrow bands indicate low volatility and can precede significant price movements, while wide bands suggest high volatility and potential reversals in trends. With these insights provided by Bollinger Bands, traders can develop effective Bollinger Bands strategies for maximizing profits in various market conditions.
Bollinger Bands Strategies
In my experience, there are several effective Bollinger Bands strategies that can be utilized in trading.
Double Bottoms and Bollinger Bands
By identifying double bottoms in relation to Bollinger Bands, you can unlock potential trading opportunities and gain a deeper understanding of market trends.
Double bottoms occur when the price of an asset reaches a low point, bounces back up, and then returns to that same low point before bouncing higher again. When these double bottoms coincide with the lower band of the Bollinger Bands indicator, it suggests that the price is reaching a strong support level and may be ready for a reversal. This can be a powerful signal for traders looking to enter long positions or close out short positions.
To further illustrate this concept, here are five key points to consider when using double bottoms with Bollinger Bands:
- Double bottoms indicate a potential reversal in price direction.
- The lower band of the Bollinger Bands acts as a support level.
- Waiting for confirmation signals such as bullish candlestick patterns can increase the reliability of the trade.
- Setting appropriate stop-loss levels below the double bottom can help manage risk.
- Monitoring volume during the formation of double bottoms can provide additional insights into market sentiment.
Reversals with Bollinger Bands
When looking for potential market reversals, it's essential to understand the relationship between price movements and the Bollinger Bands indicator. Bollinger Bands consist of three lines: the middle line, which is a simple moving average of the asset's price; and two outer bands that are standard deviations away from the middle line.
As prices move towards the upper or lower band, it indicates an overbought or oversold condition respectively. Reversals often occur when prices reach these extreme levels and start to reverse direction.
For example, if prices touch or penetrate the lower band and then start moving back toward the middle line, it could signal a potential reversal to the upside. Similarly, if prices touch or breach the upper band and then begin to move downwards, it might indicate a possible reversal to the downside.
Understanding reversals with Bollinger Bands can provide valuable insights into potential trading opportunities. By recognizing when prices have reached extreme levels based on their proximity to the bands, traders can anticipate possible changes in trend direction. However, it's important not to solely rely on this indicator but also to consider other technical analysis tools and market conditions before making trading decisions.
Riding the Bands
Maximize your trading potential by learning how to ride the bands and identify trend continuation opportunities.
Riding the Bollinger Bands involves closely following the price movement as it rides along the upper or lower band. When the price reaches the upper band, it may indicate that an uptrend is strong and likely to continue. Similarly, when the price touches or crosses below the lower band, it could suggest a robust downtrend.
By staying alert to these signals, you can capitalize on potential profit opportunities by entering trades in the direction of the trend.
Riding the bands requires a keen eye for spotting trends and understanding market dynamics. It's important to remember that riding along with these bands doesn't guarantee success every time, as there will be instances where false breakouts occur.
However, combining this strategy with other technical indicators can help improve accuracy and increase my chances of making profitable trades.
Bollinger Bands Squeeze
The Bollinger Bands Squeeze occurs when the price volatility decreases significantly, causing the upper and lower bands to narrow. This narrowing indicates a period of low volatility, often followed by a breakout or significant price movement. As a trader, this is an exciting opportunity because it means that we can potentially capitalize on the upcoming price action.
During a Bollinger Bands Squeeze, I look for signs of impending volatility in order to position myself for potential profits. One strategy I employ is to wait for the bands to squeeze together tightly and then anticipate a breakout in either direction. When the bands expand again, indicating increased volatility, I enter a trade in the direction of the breakout. This allows me to ride the momentum as the price moves away from the middle band and towards one of the outer bands.
By understanding and utilizing this Bollinger Bands strategy effectively, you can take advantage of market conditions when prices are consolidating before making big moves. The Bollinger Bands Squeeze alerts us to potential opportunities for significant price movements, helping us make better trading decisions.
Snap Back to the middle of the Bands
In a Bollinger Bands Squeeze, traders can anticipate a snap back to the middle of the bands, offering an opportunity to capitalize on potential price reversals.
When the Bollinger Bands contract and the price consolidates within a narrow range, it indicates a period of low volatility in the market. This compression is often followed by a sudden expansion in price movement, as traders rush to take advantage of new trading opportunities.
The snap back to the middle of the bands occurs when prices move from being squeezed between the upper and lower bands toward the average or middle band. This movement can be significant and presents an ideal time for traders to enter positions aligned with this potential reversal.
By recognizing this pattern and understanding its implications, traders can use Bollinger Bands effectively for their trading strategies. The snap back to the middle of the bands suggests that there may be a shift in market sentiment and momentum.
How to Use Bollinger Bands for Trading
To make trading more enjoyable, let's explore how to utilize Bollinger Bands for your strategy. Bollinger Bands are a popular technical indicator that can help identify potential price reversals and volatility in the market.
Here are four ways you can effectively use Bollinger Bands to enhance your trading approach:
Identify Overbought and Oversold Conditions: When the price of an asset reaches the upper band, it may indicate that it's overbought and due for a correction. Conversely, when the price hits the lower band, it could suggest that it's oversold and might rebound soon.
Spot Potential Trend Reversals: Bollinger Bands can be useful in identifying potential trend reversals. If the price starts moving outside of the bands, it could signal a change in direction or a breakout from a consolidation phase.
Confirm Breakouts: When an asset's price breaks out of its recent range or consolidates pattern, Bollinger Bands can provide confirmation of this breakout. If the breakout occurs with expanding bands and increased volatility, it may indicate a strong move.
Use as Stop Loss or Take Profit Levels: The upper and lower bands of Bollinger Bands can also be used as dynamic stop loss or take profit levels. As the price moves closer to these levels, you may consider adjusting your trade position accordingly.
With these strategies in mind, you can now start incorporating Bollinger Bands into your trading system to improve your decision-making process and increase your chances of success when trading financial markets.
Make Profits with Bollinger Bands Strategies
Maximize your potential profits by implementing these effective techniques that utilize Bollinger Bands as part of my overall trading approach.
One strategy is the Bollinger Squeeze, which helps identify periods of low volatility and predict potential breakouts. When the Bollinger Bands narrow, indicating a decrease in volatility, it suggests that a significant price movement might occur soon.
By waiting for this squeeze, you can anticipate breakout opportunities and take advantage of them when they happen. This technique allows you to enter trades with a high probability of success, increasing your chances of making profitable trades.
Another strategy is using Bollinger Bands in conjunction with other technical indicators to confirm trade signals. For instance, you can combine Bollinger Bands with momentum oscillators like the Relative Strength Index (RSI) or Stochastic Oscillator to validate potential entry and exit points.
If the price breaks above the upper band while the RSI confirms overbought conditions, it could be an indication to sell. Conversely, if the price falls below the lower band while the RSI confirms oversold conditions, it may be an opportunity to buy. By incorporating multiple indicators into my analysis, you can enhance my decision-making process and increase my profitability.
Tips for Bollinger Bands Trading
Mastering these helpful tips will enhance your trading skills and give you an edge when using Bollinger Bands.
The first tip is to always use Bollinger Bands in conjunction with other technical indicators. While Bollinger Bands are a powerful tool on their own, combining them with other indicators such as the Relative Strength Index (RSI) or Moving Average Convergence Divergence (MACD) can provide confirmation signals and increase the accuracy of your trades. By using multiple indicators, you can avoid false signals and make more informed trading decisions.
Another important tip is to pay attention to the width of the Bollinger Bands. When the bands narrow, it indicates low volatility in the market, which often precedes a breakout or significant price movement.
This can be a great opportunity for traders to enter positions before a big move occurs. Conversely, when the bands widen, it suggests increased volatility and potential trend reversals. Monitoring the width of the bands can help you identify optimal entry and exit points for your trades.
With practice and experience, you'll become more skilled at utilizing Bollinger Bands to gain an edge in your trading endeavors.
Conclusion
Bollinger Bands are a powerful tool for traders to analyze market volatility and identify potential trading opportunities. By using various strategies such as the squeeze play or the double bottom formation, traders can effectively utilize Bollinger Bands to make profitable trades.

