Whether you are a novice trader looking for simple yet effective techniques or an experienced trader seeking advanced strategies like divergence trading or scalping with the MACD indicator, this article will provide you with valuable insights and practical tips on how to implement these strategies successfully.
MACD Strategies - How To Use When Trading
MACD which stands for Moving Average Convergence Divergence, is a popular technical indicator used by traders to identify potential buying and selling opportunities in the financial markets. It is a versatile tool that can be applied to various trading strategies and timeframes.
In this article, Forex Prop Reviews will explore different MACD strategies that traders can use to enhance their trading performance.
What is MACD Indicator?
MACD stands for Moving Average Convergence Divergence, and it's one of the most popular technical analysis strategies used by traders all over the world. This indicator helps traders identify potential trend reversals, gauge market momentum, and generate buy or sell signals.
By analyzing the relationship between two moving averages of a security's price, MACD provides valuable insights into market trends and can be a powerful tool in your trading arsenal.
MACD strategies are based on the concept of convergence and divergence between the two moving averages. When the shorter-term moving average crosses above the longer-term moving average, it indicates a bullish signal.
On the other hand, when the shorter-term moving average crosses below the longer-term moving average, it suggests a bearish signal. Traders use these signals to enter or exit trades accordingly.

Parameters for the MACD indicator
One important aspect to consider when analyzing the MACD indicator is the selection of suitable parameters. The MACD indicator consists of three components: the MACD line, the signal line, and the histogram. Each component requires specific parameters to be set in order to provide accurate signals for trading decisions.
Firstly, we have the parameter for calculating the MACD line, which is typically set as a 12-day exponential moving average (EMA) minus a 26-day EMA. This parameter determines how sensitive or smooth the MACD line will be in responding to price changes. A shorter period will make it more reactive while a longer period will make it smoother.
Secondly, we have the parameter for calculating the signal line, which is usually set as a 9-day EMA of the MACD line. This parameter helps filter out noise and generates trading signals based on crossovers with the MACD line.
Lastly, we have the parameter for determining how to display information on the histogram. By default, this is usually set as a bar graph that shows positive or negative values above or below zero respectively.
Simplest MACD Strategy
To effectively utilize the simplest MACD strategy, you must understand how to optimize your parameters and interpret the signals it generates.
The MACD indicator consists of two lines - the MACD line and the signal line. By default, these lines are calculated using a 12-day exponential moving average (EMA) for the MACD line, a 26-day EMA for the signal line, and a 9-day EMA for the histogram. However, you can adjust these parameters to suit different trading styles or market conditions.
Optimizing the parameters involves finding values that work well with your chosen time frame and asset. For example, if you're trading on a shorter time frame like the 5-minute chart, you might benefit from using smaller values such as a 3-day EMA instead of 12 days. On the other hand, if you're trading on a longer time frame like the daily chart, larger values may provide more reliable signals.
Interpreting MACD signals is crucial for the successful implementation of this strategy. When the MACD line crosses above the signal line, it generates a bullish signal indicating potential buying opportunities.
Conversely, when the MACD line crosses below the signal line, it generates a bearish signal indicating potential selling opportunities. Additionally, traders often look for divergences between price action and MACD lines to identify trend reversals or weaknesses in ongoing trends.

MACD Divergence
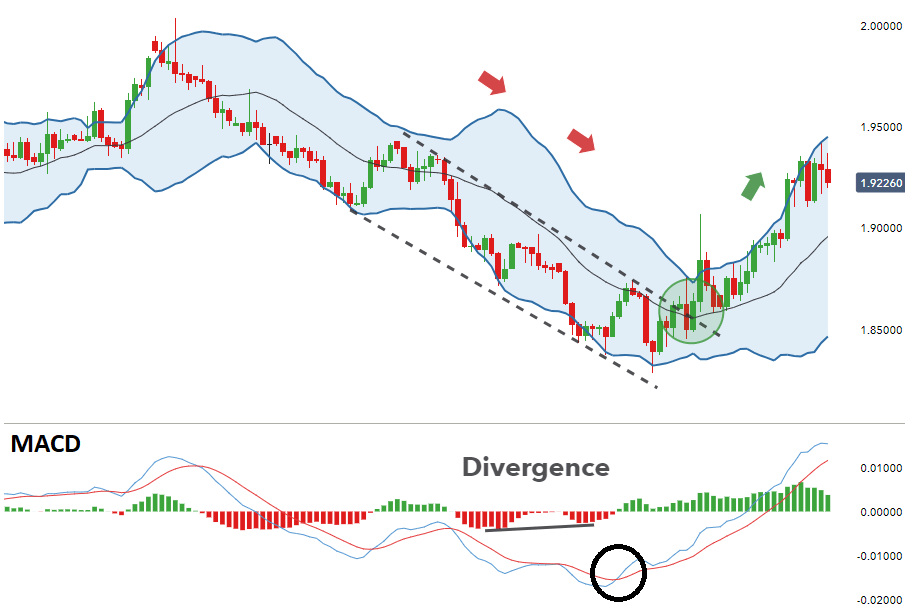
Explore the fascinating world of MACD divergence and gain a deeper understanding of market dynamics to enhance your trading skills. MACD divergence occurs when there's a discrepancy between the price action and the MACD indicator.
This can signal a potential reversal in the market trend or a continuation of the current trend. By recognizing these divergences, traders can make more informed decisions and improve their overall profitability.
Here are five key points to understand about MACD divergence:
- Bullish Divergence: This occurs when the price makes lower lows while the MACD indicator forms higher lows. It suggests that selling pressure's weakening, indicating a potential upward reversal.
- Bearish Divergence: On the other hand, bearish divergence happens when the price makes higher highs while the MACD indicator forms lower highs. This indicates that buying pressure's fading, signaling a potential downward reversal.
- Hidden Bullish Divergence: This type of divergence occurs when there are higher lows in price action but lower lows on the MACD histogram. It suggests that momentum's building up for an upcoming bullish move.
- Hidden Bearish Divergence: Conversely, hidden bearish divergence happens when there are lower highs in price action but higher highs on the MACD histogram. It indicates that momentum's building up for an upcoming bearish move.
- Confirmation with Other Indicators: While MACD divergence can be powerful on its own, it's often recommended to confirm signals with other technical indicators or chart patterns for stronger trade setups.

Scalping with the MACD Indicator
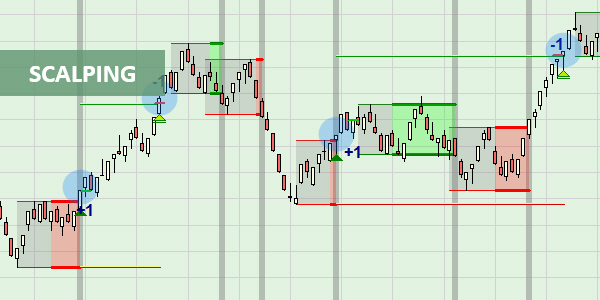
Scalping with the MACD indicator allows you to swiftly capture short-term price movements, maximizing your trading opportunities and achieving accurate results.
Scalping is a trading strategy that aims to take advantage of small price changes in the market. The MACD (Moving Average Convergence Divergence) indicator is a popular tool used by traders to identify potential buy and sell signals.
To scalp with the MACD indicator, I first look for a strong trend in the market. You then use the MACD histogram to identify divergences between the price action and the indicator itself. This helps you spot potential reversals or continuation patterns.
When you see a positive divergence, where the price makes lower lows while the MACD makes higher lows, it indicates that selling pressure may be weakening and a potential buying opportunity arises.
Conversely, if you spot a negative divergence, where the price makes higher highs while the MACD makes lower highs, it suggests that buying pressure may be waning and a potential selling opportunity presents itself.
Once you have identified these divergences, you enter trades using tight stop-loss orders to limit your risk exposure. This strategy requires discipline and attentiveness as scalping involves making rapid decisions based on short-term fluctuations in prices.

Conclusion
MACD strategies can be a valuable tool for traders looking to identify trends and potential entry and exit points in the market. The MACD indicator provides clear signals based on moving averages and has parameters that can be customized to suit individual trading styles.


