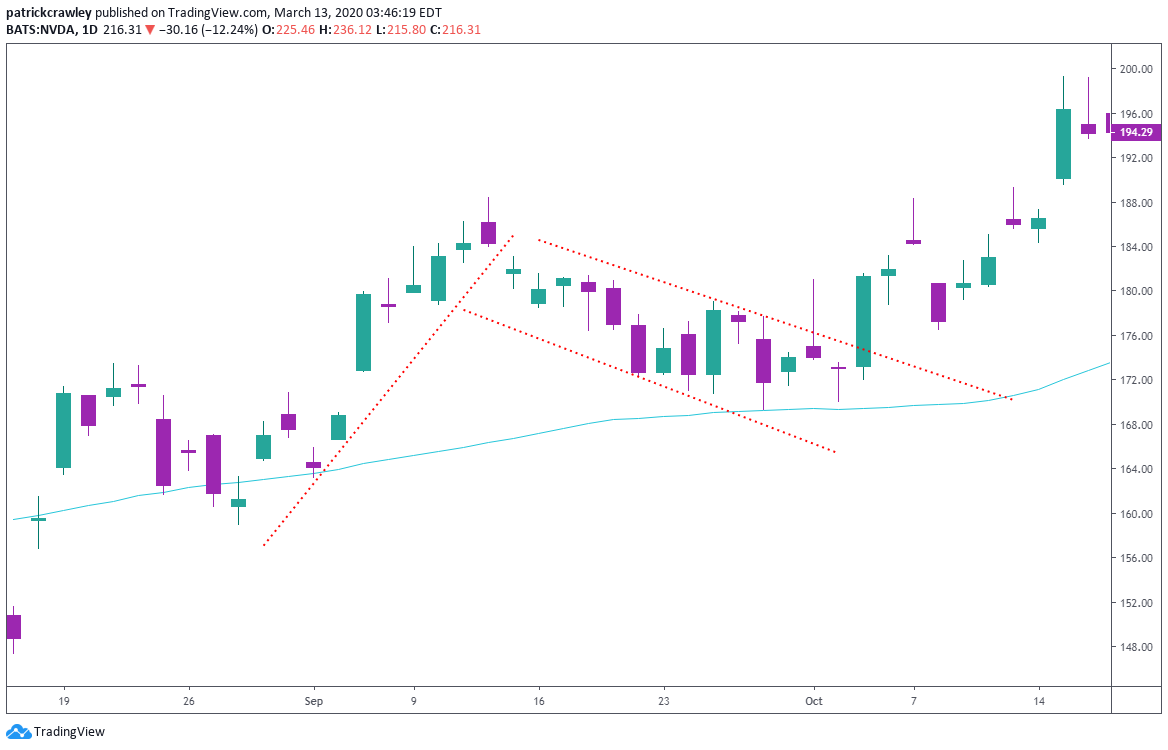
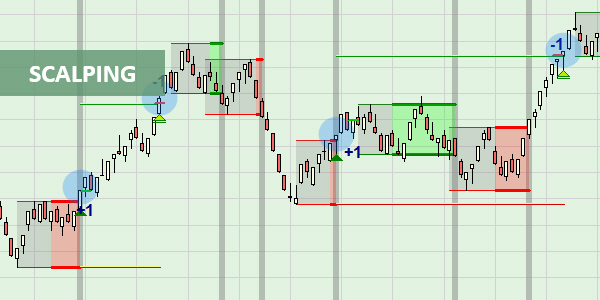
In this article, we’ll dive in and discover the key elements of a swing trading chart setup that will empower you on your journey as a trader.
How to create a Swing Trading Chart Setup?
When it comes to trading, having the right chart setup can make all the difference. As a trader myself, I have found that a swing trading chart setup is essential for success in this strategy.
In this article, Forex Prop Reviews will explore why traders should set up a swing trading chart and how to create an optimal setup. By understanding the importance of charts in swing trading and learning how to utilize them effectively, you can enhance your ability to spot trends, analyze patterns, and execute profitable trades.
Why traders should set up Swing Trading Chart?
Setting up a swing trading chart is essential for any trader looking to implement successful swing trading strategies. A swing trading chart provides a visual representation of price movements over a specific period, allowing traders to identify trends and patterns that can be capitalized on.
By analyzing these charts, traders can make informed decisions about when to enter or exit trades, maximizing their profits and minimizing their risks.
The swing trading chart setup gives you the ability to spot potential entry and exit points with ease. It allows you to identify key support and resistance levels, trend lines, and other technical indicators that help guide your decision-making process.
With this information at hand, you’re able to develop well-informed strategies that align with your risk tolerance and investment goals.
Now let's move on to how we can create the optimal swing trading chart setup without missing out on any crucial steps.

How to Create the Optimal Swing Trading Chart Setup
To create the ultimate chart arrangement for successful swing trading, it's essential to focus on specific indicators and implement them strategically. By incorporating the following elements into your chart setup, you can greatly enhance your chances of making profitable trades:
- Moving Averages: Including both short-term and long-term moving averages helps identify trends and potential entry or exit points.
- Fibonacci Retracement Levels: These levels help pinpoint potential support or resistance areas based on previous price movements.
- Volume Indicator: Monitoring volume can provide valuable insights into market sentiment and confirm the strength of a trend.
- Oscillators: Using oscillators like the Relative Strength Index (RSI) or Stochastic Oscillator can help identify overbought or oversold conditions, indicating possible reversals.
By combining these indicators in a way that complements your trading strategy, you can create an optimal swing trading chart setup that maximizes your potential for success.

How to use Swing Charts?
Let's dive into the art of utilizing swing charts effectively for profitable trades without missing out on any opportunities.
Swing charts are a valuable tool in my trading arsenal as they help me identify and capitalize on short-term price movements within a larger trend. By analyzing swing highs and lows, I can gauge the strength of the market and make informed decisions about when to enter or exit a trade.
To use swing charts, you first identify the most recent swing high and low points on the chart. These points act as reference levels for future price action. When the market breaks above a previous swing high, it indicates bullish momentum and presents an opportunity to go long.
Conversely, when the market falls below a previous swing low, it signals bearish momentum and suggests considering short positions. By waiting for these breakouts or breakdowns, you can ensure that you’re entering trades at favorable levels with a higher probability of success.
Next, you pay attention to the duration between swings to determine the trend's strength and potential reversals. If swings are occurring rapidly with little time between them, it suggests a strong trending market where quick profits can be made by capturing smaller price fluctuations.
On the other hand, if swings are taking longer to form or becoming less pronounced, it may indicate weakening momentum or an impending trend reversal.
Understanding how to effectively use swing charts is crucial for successful swing trading strategies. By identifying key swing highs and lows and analyzing their durations, you can make well-informed decisions about when to enter or exit trades based on market trends.
With practice and experience, utilizing these tools becomes second nature and greatly enhances your ability to profit from short-term price movements while minimizing risk.

Frequently Asked Questions
What are the benefits of using swing trading charts in comparison to other trading strategies?
The benefits of using swing trading charts over other strategies are that they provide clear entry and exit points, help identify trends, and allow for more precise risk management.
Are there any specific indicators or tools that are recommended for setting up swing trading charts?
There are several recommended indicators and tools for setting up swing trading charts. Moving averages, MACD, and Fibonacci retracement levels are commonly used to identify trends and potential entry points in swing trading.
How frequently should swing trading charts be updated or adjusted?
You update and adjust your swing trading charts regularly to ensure they reflect the most current market conditions. This helps you make informed decisions and maximize potential profits.
Can swing trading charts be used for multiple markets or are they specific to certain asset classes?
Swing trading charts can be used for multiple markets and are not specific to certain asset classes. They provide a versatile tool that allows you to analyze price patterns and make informed trading decisions across various markets.
Are there any common mistakes or pitfalls to avoid when setting up swing trading charts?
When setting up swing trading charts, it's important to avoid common mistakes and pitfalls. These can include using incorrect timeframes, not considering market trends, or neglecting to incorporate proper risk management strategies.
Conclusion
In conclusion, a swing trading chart setup is crucial for traders who want to effectively analyze market trends and make informed decisions. By creating an optimal chart setup, traders can easily identify potential entry and exit points, as well as track price movements over time.
So don't delay, take the time to set up your swing trading chart today and start reaping the benefits!


.jpg)


