Having an effective scalping chart setup is crucial for success. By using the right timeframe, incorporating moving averages, and leveraging technical indicators, you can make informed trading decisions and maximize your potential for profit in the forex market.
Optimizing Your Trading Efficiency: The Power of Scalping Chart Setup
When it comes to trading in the fast-paced world of forex, having a solid scalping chart setup can make all the difference. As a trader, I understand the importance of being able to quickly identify and capitalize on short-term price movements. That's where scalping comes in.
In this article, Forex Prop Reviews will unlock the secrets of scalping chart setup.
Introduction to Scalping and Scalping Chart Setup
The key to successful scalping lies in having a well-organized chart that provides all the necessary information at a glance. When setting up your scalping chart, there are a few important factors to consider.
Firstly, you need to choose the right indicators for your scalping strategies. These indicators should help you identify entry and exit points quickly and accurately. Popular indicators for scalpers include moving averages, Bollinger Bands, and MACD.
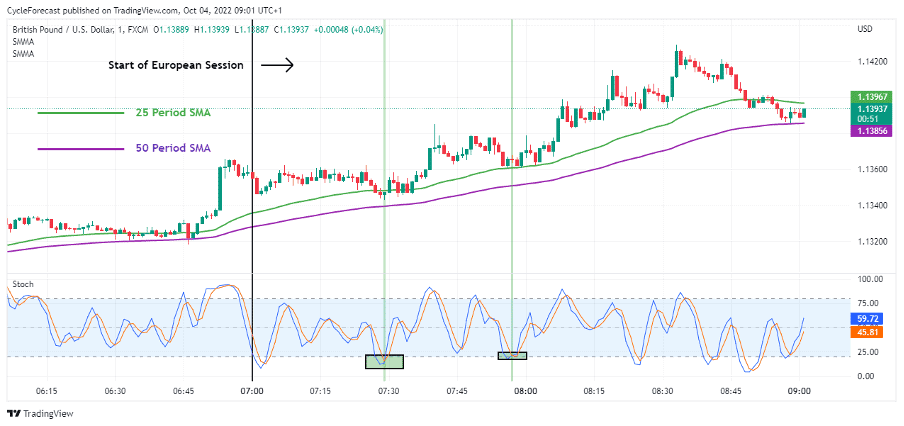
In addition to choosing the right indicators, it is essential to set up your chart with the appropriate timeframes. Scalpers typically focus on short-term price movements, so it is common to use lower timeframes such as 1-minute or 5-minute charts. These shorter timeframes allow you to spot quick opportunities and make fast decisions.
However, it's important not to solely rely on one timeframe; incorporating multiple timeframes can provide valuable confirmation signals for trade entries and exits.
By carefully selecting indicators and using appropriate timeframes in your scalping chart setup, you'll be well-equipped to navigate the fast-paced world of scalp trading successfully without missing out on potential profit opportunities.

The timeframe in Scalping Chart Setup
When it comes to scalping chart setup, utilizing short timeframes is crucial. This allows for quick decision-making and taking advantage of small price movements.
Utilizing short timeframes
By utilizing short timeframes, such as one-minute or five-minute charts, you’re able to identify and capitalize on rapid price movements in the market. This allows you to enter and exit trades swiftly, taking advantage of even the smallest fluctuations in price.
The use of short timeframes enables you to stay focused and make precise decisions based on real-time market data. With each candlestick representing just a few minutes of trading activity, you can quickly assess market sentiment and identify potential entry and exit points.
Moreover, shorter timeframes provide more opportunities for profit as they allow for multiple trades within a single trading session. However, it's important to remember that choosing the appropriate timeframe is crucial in scalping strategy implementation as it can greatly affect trade execution and overall profitability.
Choosing the appropriate timeframe
By selecting the right timeframe, you can navigate the ever-changing market with finesse and precision. The appropriate timeframe for scalping chart setup is crucial because it determines the accuracy of your analysis and the effectiveness of your trading strategy.
When choosing a timeframe, you consider factors such as market volatility, liquidity, and your personal trading style. If the market is highly volatile, you may opt for shorter timeframes like 1-minute or 5-minute charts to capture quick price movements.
On the other hand, if the market is relatively stable, you might choose longer timeframes like 15-minute or 30-minute charts to identify more significant trends.
Selecting the appropriate timeframe also depends on your trading style. As a scalper, I aim to make small profits from frequent trades within a short period. Therefore, using shorter timeframes allows me to quickly spot potential entry and exit points based on rapid price fluctuations.
However, it's important to note that shorter timeframes require constant monitoring and can be more susceptible to noise and false signals.

Moving Averages in Scalping Chart Setup
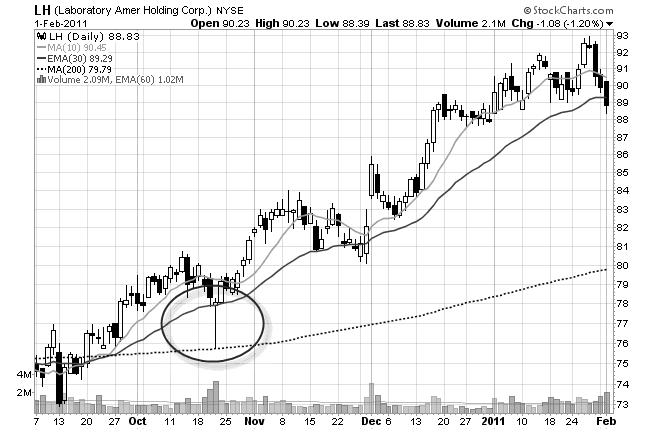
Moving averages help to visually represent the trend and direction of price movements in a scalping chart setup. By calculating the average closing prices over a specific period, moving averages smooth out the price data and provide traders with a clearer picture of market trends.
For scalpers, who aim to take advantage of short-term price fluctuations, using moving averages can be particularly beneficial. They allow you to identify whether the overall trend is bullish or bearish, which helps inform our trading decisions. Additionally, by using different timeframes for our moving averages, you can gain insight into both short-term and long-term trends simultaneously.
As you move forward and explore technical indicators in a scalping chart setup, it's important to note that moving averages serve as just one tool in our arsenal. While they provide valuable information about market trends, they don't provide explicit buy or sell signals on their own.
Technical Indicators in Scalping Chart Setup
In a scalping chart setup, it's crucial to utilize technical indicators to enhance trading decisions. These indicators help identify potential trend reversals, overbought or oversold conditions, and market momentum.
MACD (Moving Average Convergence Divergence)
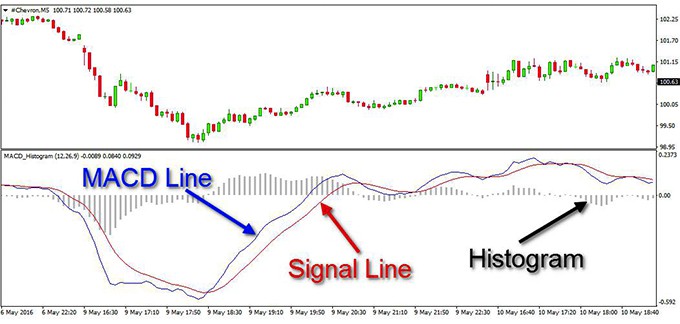
The MACD indicator is like a skilled artist, painting a vivid picture of the market's momentum. It consists of two lines - the MACD line and the signal line - as well as a histogram.
The MACD line represents the difference between two moving averages, typically the 12-period and 26-period exponential moving averages (EMA). Meanwhile, the signal line is a 9-period EMA of the MACD line.
When these lines cross over or diverge from each other, it provides valuable information about potential changes in market direction. Additionally, the histogram visually displays the distance between these two lines, showing whether bullish or bearish momentum is increasing or decreasing.
With its ability to identify trends and generate buy/sell signals, the MACD indicator plays a crucial role in scalping chart setups. Traders often look for instances where the MACD line crosses above or below the signal line as confirmation of entry or exit points. This crossover can indicate shifts in momentum that may lead to profitable trading opportunities.

RSI (Relative Strength Index)
Get ready to take your trading skills to the next level with RSI. This powerful tool enhances my understanding of market conditions and helps me make more effective decisions.
The Relative Strength Index, or RSI, is a momentum indicator that measures the strength and speed of price movements in order to identify overbought or oversold levels. It is widely used by traders to determine potential trend reversals and generate buy or sell signals.
The RSI is plotted on a scale from 0 to 100, with readings above 70 indicating overbought conditions, and readings below 30 indicating oversold conditions. By analyzing these levels, you can gauge the likelihood of a price correction or reversal.
When the RSI reaches extreme levels, it suggests that the market may be due for a pullback or consolidation phase. Conversely, if the RSI remains in the middle range (between 30 and 70), it indicates a stable market condition without any extreme buying or selling pressure.
Using RSI in conjunction with other technical indicators such as MACD can provide valuable insights into market trends and help me make more informed trading decisions. By understanding how momentum indicators like RSI work and incorporating them into your scalping chart setup, you can better navigate volatile markets and improve your chances of success in trading.
Momentum Indicator
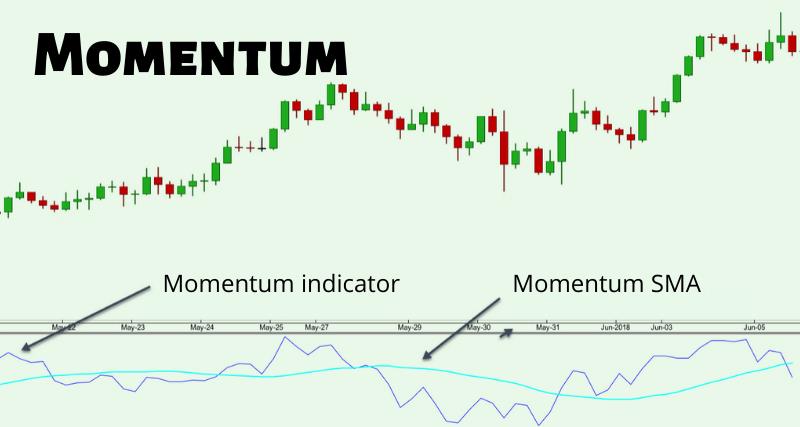
This indicator is used to measure the speed and strength of a price movement, helping traders identify potential trend reversals or confirm existing trends.
It calculates the rate of change in prices over a specific period and displays it as a line graph below the price chart. The Momentum Indicator is typically displayed as a single line that oscillates around a centerline at zero.
When the line is above zero, it indicates positive momentum and suggests an upward price movement. Conversely, when the line is below zero, it signifies negative momentum and suggests a downward price movement. Traders often look for divergences between price action and the Momentum Indicator to identify possible trend reversals.
Additionally, they may use overbought or oversold levels on the indicator to determine potential entry or exit points for trades. The Momentum Indicator measures the speed and strength of price movements and helps identify potential trend reversals or confirm existing trends.
Traders can use divergences, overbought/oversold levels, and zero-line crossovers for trading signals.

Conclusion
In conclusion, scalping is a fast-paced trading strategy that requires quick decision-making and accurate chart setups. By understanding the importance of timeframe in scalping chart setup, traders can effectively identify short-term trends and make timely trades.


.jpg)


