Moving Averages Strategies have become an essential tool for traders in the financial markets. As someone who is interested in trading, I have found that understanding and utilizing moving averages can greatly enhance my decision-making process.
What is Moving Average Strategies? Review Moving Average Strategies
Whether you’re a short-term trader looking to capitalize on quick market movements or a long-term investor seeking to identify major trends, incorporating moving averages into your trading strategy allows you to navigate the market more confidently and effectively.
By using moving averages strategies, you can analyze market trends and make informed decisions based on historical data.
Now, let’s learn more about Moving Averages Strategies in Forex Prop Reviews's article.
What is Moving Averages Strategies?
If you're new to trading, moving averages strategies are a powerful tool that can help you visualize and analyze the trends in stock prices by smoothing out price fluctuations over time.
In simple terms, a moving average is calculated by taking the average closing price of a stock over a specified period. This period can range from days to weeks or even months, depending on your preference.
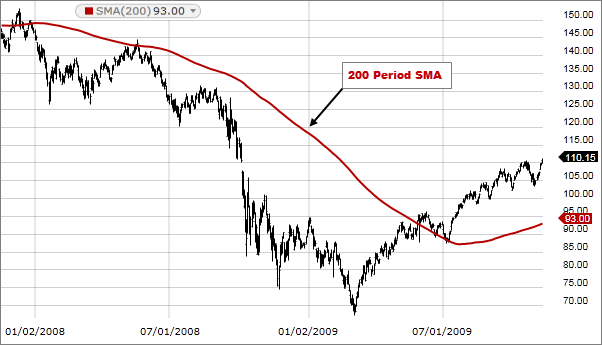
By plotting these averages on a chart, you can easily identify whether the stock is trending upwards or downwards.
Using moving averages strategies allows you to gain valuable insights into market trends. It helps remove noise and short-term volatility from the equation, giving you a clearer picture of the overall direction of the market.
By observing how different moving averages interact with each other and with the stock's price action, you can make more informed decisions about when to buy or sell stocks. Moving averages strategies provide traders with an objective way to identify potential entry and exit points based on historical data analysis.

Pros of using Moving Averages
Embrace the power of utilizing moving averages and witness firsthand how these dynamic indicators can enhance your trading performance.
One of the main advantages of using moving averages is that they provide a clear visual representation of the overall trend in the market.
By smoothing out price fluctuations, moving averages help traders identify whether the market is trending up or down, making it easier to make informed decisions. This can be especially useful for long-term investors who want to ride a trend and maximize their profits.
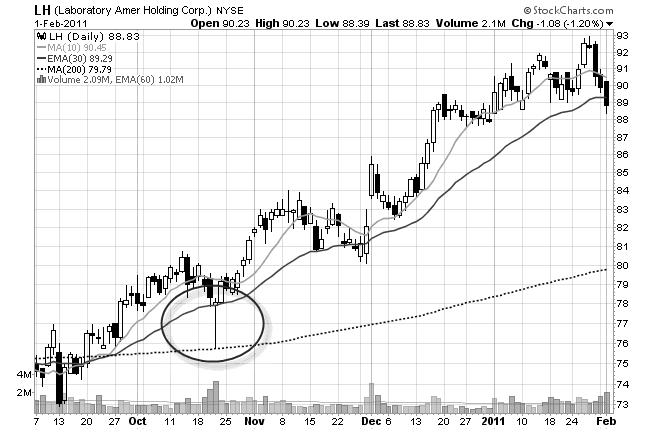
Another advantage of using moving averages is that they can act as support and resistance levels. When prices approach a moving average, it often acts as a barrier that prevents further movement in that direction.
This allows traders to set stop-loss orders or take-profit targets at these levels, reducing their risk and increasing their chances of making profitable trades.
Cons of using Moving Averages
Despite their usefulness in identifying trends and potential entry/exit points, there are drawbacks to using moving averages in trading.
One disadvantage is that moving averages tend to lag behind the current price action. This means that by the time a moving average crossover or signal occurs, the market may have already moved significantly in the opposite direction.
This can result in missed opportunities or entering trades too late. It's frustrating to see a trade setup based on a moving average signal, only for the market to reverse before
Another drawback of using moving averages is that they may not work well in choppy or sideways markets. Moving averages are designed to identify and follow trends, but if the market is range-bound and lacks clear direction, these indicators can give false signals leading to losses.
In such situations, relying solely on moving averages can be misleading and lead to poor trading decisions.
Moving average trading strategies
In my trading experience, I've found three moving average strategies to be particularly effective.
Triple Moving Average Crossover Strategy
Utilize the Triple Moving Average Crossover Strategy to improve trading skills and increase profits. This strategy uses three different moving averages with varying periods to identify trends and generate buy or sell signals. Using short-term, medium-term, and long-term moving averages, the strategy filters out false signals, improving trading accuracy.
Moving Average Ribbon
The Moving Average Ribbon is a visual representation of multiple moving averages on a price chart, helping traders identify trends and potential entry or exit points. By plotting these moving averages with different periods, traders can observe their interactions and identify areas of support or resistance.
Studying the Moving Average Ribbon helps make informed trading decisions, identify potential entry points, and predict market direction changes. It also prepares traders for exploring indicators like moving average convergence divergence (MACD).
:max_bytes(150000):strip_icc()/MovingAverageRibbon-e47a05f1c0164817ad3411547ce72c35.png)
Moving Average Convergence Divergence (MACD)
MACD is a momentum indicator that helps traders identify potential market shifts and make informed decisions. It shows the relationship between two moving averages of a security's price, with the MACD line and signal line as its components. Analyzing crossovers and divergences helps anticipate market changes. Different types of moving averages, such as SMA, EMA, and WMA, can be used in conjunction with MACD to provide insights into market trends and potential signals for trading decisions. Each type has its strengths and weaknesses, allowing traders to customize their approach according to their individual needs.
Types of moving averages
There are several types of moving averages that traders use in their trading strategies. Each type has its calculation method and can be used to analyze different aspects of the market, providing valuable insights for traders.
Simple Moving Average (SMA)
One way to analyze stock performance is by using a simple moving average (SMA). The SMA calculates an average price over a specified period. The SMA is widely used because it provides a clear and straightforward indication of the overall trend in the stock's price.
To calculate the SMA, you simply add up the closing prices for a specific number of periods and divide by that number. For example, if you want to calculate the 50-day SMA, you would take the closing prices for the past 50 days and divide by 50. This gives you an average price that smooths out any short-term fluctuations and helps identify long-term trends.
The SMA is especially useful for identifying support and resistance levels in a stock's price chart. When the stock's price crosses above its SMA, it can be seen as a bullish signal, indicating that there may be further upward momentum. Conversely, when the price falls below its SMA, it can be interpreted as a bearish sign, suggesting potential downward pressure on the stock.
By analyzing these crossovers and comparing them with implementing technical analysis strategies, traders can make more informed decisions about buying or selling stocks.

Weighted Moving Average (WMA or LWMA)
To better analyze stock performance, you can utilize a weighted moving average (WMA or LWMA) that assigns varying weights to each data point. Unlike the simple moving average (SMA), which gives equal weight to all data points, the WMA takes into account the importance of recent data by assigning higher weights to more recent values.
This means that the WMA provides a more accurate representation of future trends in stock prices. By assigning different weights to each data point, the WMA places greater emphasis on recent price movements while still considering older data. This makes it particularly useful for short-term analysis and identifying potential changes in market direction.
For example, if there has been a significant increase in stock prices over the past week, the WMA will assign more weight to those recent values and reflect this upward trend in its calculation.
Exponential Moving Average (EMA or EWMA)
The exponential moving average (EMA or EWMA) is a powerful tool for analyzing stock performance as it places a stronger emphasis on recent data and assigns exponentially decreasing weights to older prices.
This means that the EMA gives more weight to the most recent prices, making it more responsive to changes in market trends. By doing so, it helps traders identify potential buy or sell signals earlier than other moving averages.
One of the key advantages of using the EMA is its ability to reduce lag compared to other types of moving averages. Since it assigns higher weights to recent prices, it reacts faster to price movements and provides a more up-to-date view of market conditions. This can be particularly useful when trading in fast-moving markets where timing is crucial.

Triangular Moving Average (TMA)
Get ready to smooth out your price data with the Triangular Moving Average (TMA), a popular tool among traders for identifying trends and making sense of market conditions. The TMA is similar to other moving averages, but it puts more weight on recent prices while still considering past prices.
This unique characteristic allows the TMA to respond quickly to changes in market conditions, making it a valuable tool for traders looking to stay ahead of the curve.
Using the TMA can evoke a sense of confidence and clarity in traders as they analyze price data. With its ability to filter out noise and highlight trends, the TMA helps traders make informed decisions based on reliable information. It provides a smoother representation of price movements compared to other moving averages, allowing traders to better understand market dynamics.
Variable Moving Average (VMA)
The VMA is a powerful indicator that adjusts its weight based on market conditions, providing more accurate signals compared to traditional moving averages.
By factoring in both volume and volatility, the VMA adapts to changing market dynamics, allowing traders to better identify trends and potential entry or exit points.
Unlike other moving averages, which assign equal weightage to each data point, the VMA gives more importance to periods with higher volume or volatility. This means that during periods of increased market activity, such as high-volume trading sessions or volatile price movements, the VMA will place greater emphasis on these data points when calculating the average.
As a result, traders can obtain a clearer picture of current market sentiment and make more informed decisions.

Conclusion
Moving averages strategies can be a valuable tool for traders looking to analyze and predict market trends. The use of moving averages provides a clear and objective way to identify potential buy or sell signals. By smoothing out price data over a specified period, these strategies help traders filter out noise and focus on the overall trend.


