A day trading chart setup refers to the arrangement and configuration of charts that traders use to analyze and make decisions in real time. In this post, we'll discuss the day trading breakout setup.
What is Day Trading Breakout Setup? Why use it?
When it comes to day trading, having a solid chart setup is crucial for success. As a day trader myself, I understand the importance of having clear and actionable views of the market.
In this article, Forex Prop Reviews will share with you the ins and outs of day trading chart setup and why they are essential in my trading strategy.
What is a Day Trading Chart Setup?
A day trading chart setup refers to the specific arrangement of charts and indicators that traders use to analyze price movements and make trading decisions within a single trading day. It is an essential tool for day traders as it provides them with valuable insights into market trends, patterns, and potential entry or exit points.
A well-designed day trading chart setup helps traders identify profitable opportunities in real-time and execute their day trading strategies effectively.
Day trading chart setups typically involve the use of various technical indicators such as moving averages, trend lines, volume analysis tools, and oscillators. Traders customize these charts based on their preferred timeframes and trading strategies.
For example, some traders may focus on short-term momentum plays using one-minute or five-minute charts, while others may prefer longer timeframes like 15 minutes or one hour.
By analyzing these charts along with other key factors such as volume and support/resistance levels, traders can gain a better understanding of market dynamics and make informed decisions about when to buy or sell.

Why use a Day Trading Chart Setup?
To fully grasp the potential of my trades, I envision a carefully designed blueprint that visually guides me toward profitable opportunities. That's why I use a day trading chart setup. It provides me with a clear and organized view of the market, allowing me to quickly analyze price movements and identify patterns.
With this setup, I can make informed decisions based on real-time data, increasing my chances of making successful trades. Using a day trading chart setup offers several benefits that have greatly enhanced my trading experience. Here are three reasons why I find it invaluable:
- Visualization: The charts provide a visual representation of price movements, helping me spot trends and patterns more easily than just looking at numbers or text data.
- Efficiency: By having all the relevant information in one place, I can quickly analyze multiple stocks or currency pairs simultaneously. This saves time and allows me to seize opportunities as they arise.
- Accuracy: The accuracy of my analysis is improved by using technical indicators and tools available on the charts. These indicators help me identify entry and exit points more precisely.
By utilizing a day trading chart setup, I can navigate the market with confidence and increase my chances of success.
:max_bytes(150000):strip_icc()/daytradingsetup2-596d02d33df78c57f4aafa56.png)
Day Trading Chart Setup
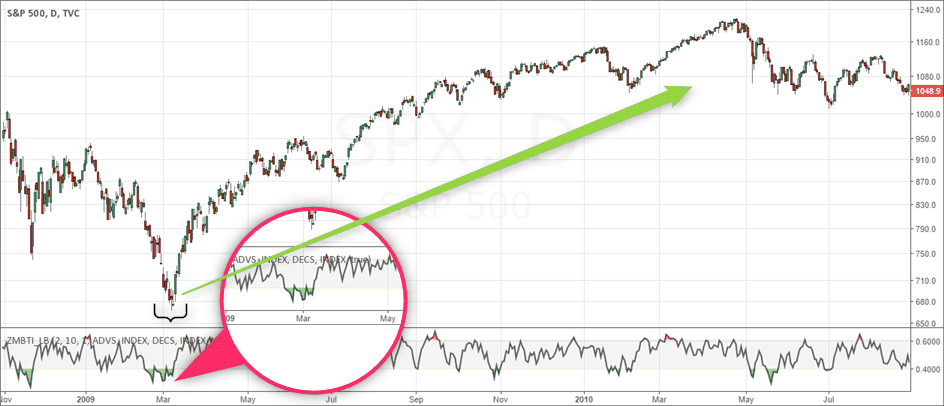
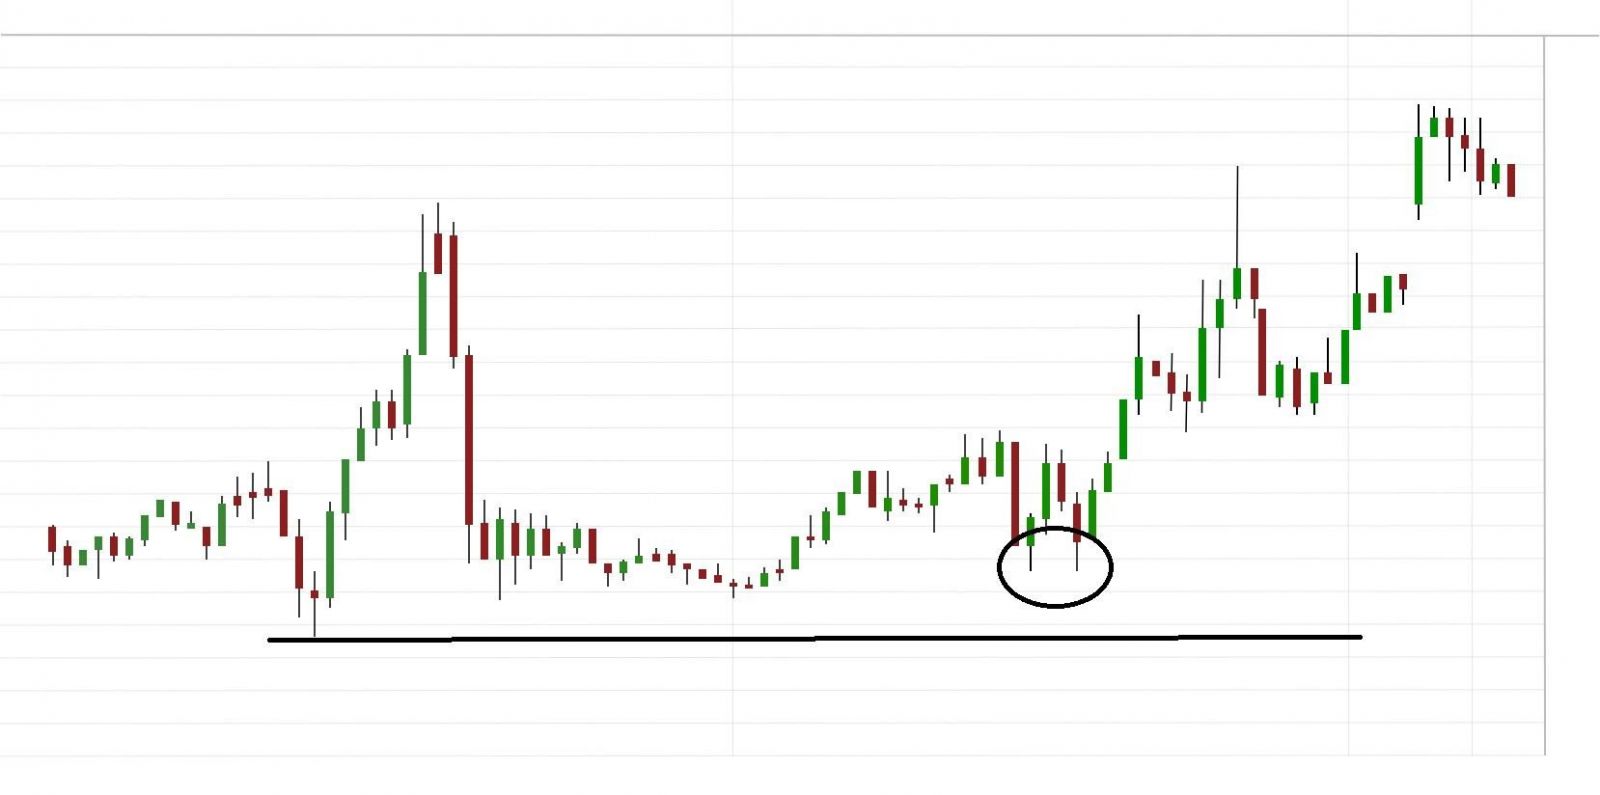
When setting up my charts for day trading, I want to create a visual roadmap that guides me toward profitable opportunities. By carefully selecting the right indicators and timeframes, I can identify key support and resistance levels, as well as trend lines and patterns that may indicate potential trade setups.
This allows me to make informed decisions based on the current market conditions and increases my chances of success.
Additionally, having a well-organized chart setup helps me stay focused and avoid unnecessary distractions during fast-paced trading sessions.
Creating a Clear and Actionable View of the Market
With a well-organized and visually appealing chart arrangement, day traders can effortlessly navigate the market and spot potential profit opportunities. Creating a clear and actionable view of the market is essential for successful day trading.
By customizing your chart setup to display key indicators, such as moving averages and trend lines, you can quickly identify patterns and trends that may indicate potential buy or sell signals. This allows you to make informed decisions in real time without wasting precious moments trying to decipher complex data.
In addition to indicators, I also utilize different time frames on my charts to gain a comprehensive understanding of the market's behavior. For example, by examining both short-term intraday charts as well as longer-term daily or weekly charts, I can identify both micro-level price movements and macro-level trends.
This multi-timeframe analysis helps me avoid making impulsive trades based on short-term fluctuations and instead focus on high-probability setups with stronger underlying trends.
Furthermore, I ensure that my chart setup is clutter-free by removing unnecessary elements that may distract me from key information. By selecting a clean color scheme and using minimalistic charting tools, I can maintain a clear focus on the most important aspects of the market. This simplicity allows me to quickly assess price action, volume levels, and any significant news events that may impact my trading decisions.
Overall, creating a clear and actionable view of the market through an organized chart setup empowers you as a day trader. It enables you to make quick decisions based on reliable information while minimizing distractions. With this approach, you may feel confident in navigating the complexities of the market and identifying profitable opportunities for successful day trading.

Frequently Asked Questions
What are the most common indicators used in a day trading chart setup?
The most common indicators used in day trading chart setups are moving averages, relative strength index (RSI), and stochastic oscillators. These tools help you analyze price trends, identify potential entry and exit points, and gauge market momentum.
How do I choose the right time frame for my day trading chart setup?
To choose the right time frame for your day trading chart setup, you consider your trading style and goals. You look at shorter time frames for quick trades and longer ones for more reliable trends.
Are there any specific chart patterns that are more effective for day trading?
There are several chart patterns that can be effective for day trading, such as triangles, flags, and double tops/bottoms. These patterns can help identify potential breakouts or reversals in the market.
Can I use a day trading chart setup for long-term investing as well?
Yes, a day trading chart setup can be used for long-term investing as well. It provides valuable information about price trends and patterns that are useful for making informed investment decisions over an extended period of time.
How often should I update or adjust my day trading chart setup?
You should update or adjust your day trading chart setup frequently, as market conditions can change rapidly. Staying on top of new information and trends will help you make informed decisions and maximize your trading opportunities.
Conclusion
In conclusion, using a day trading chart setup is crucial for successful day trading. It provides traders with a clear and actionable view of the market, allowing them to make informed decisions and execute trades effectively.
By utilizing various technical indicators, such as moving averages and trendlines, traders can identify key levels of support and resistance, spot potential entry and exit points, and manage risk more efficiently.


