The RSI strategies will help traders identify overbought or oversold conditions in a particular asset, which can be valuable information when making trading decisions.
RSI Strategies - How to use RSI indicator
I have always been on the lookout for practical trading strategies that can help me make informed decisions in the stock market. One strategy that has caught my attention is the use of the RSI (Relative Strength Index) indicator.
In this article, Forex Prop Reviews will delve into what exactly the RSI strategies are and how they can be implemented to enhance trading strategies.
What is the RSI indicator?
If you're looking to gain a better understanding of the RSI indicator, you'll be thrilled to discover how this powerful tool can provide valuable insights into market trends and potential trading opportunities.
The RSI, or Relative Strength Index, is one of the popular technical analysis strategies used by traders to identify overbought and oversold conditions in the market. By analyzing price movements and comparing the magnitude of recent gains to recent losses, the RSI helps traders determine whether an asset is likely to be overvalued or undervalued.
One of the key benefits of using the RSI indicator is its ability to generate buy and sell signals based on overbought and oversold conditions. When the RSI reaches a certain threshold, typically above 70 for overbought or below 30 for oversold, it indicates that the asset may be due for a reversal in price. Traders can then use this information to make informed decisions about when to enter or exit trades.
By incorporating RSI strategies into their overall trading approach, traders can potentially increase their chances of success by identifying potential turning points in the market.
How to implement indicator settings
To implement indicator settings, you can easily adjust the parameters to fit my trading style and preferences. The RSI indicator has a default setting of 14 periods, which means it looks at the past 14 candles or bars on the chart to calculate its values. However, this value can be changed depending on your preference.
If you want a shorter-term RSI, you can decrease the number of periods to say 9 or 7. On the other hand, if you prefer a longer-term RSI, you can increase the number of periods to 20 or even higher. By adjusting these settings, you have more control over the sensitivity and responsiveness of the indicator.
How to trade with RSI indicator
Utilizing the RSI indicator allows you to effectively identify potential reversal points and make informed decisions based on its signals, maximizing profit opportunities.
The RSI, or Relative Strength Index, is a momentum oscillator that measures the speed and change of price movements. By understanding how to trade with this indicator, you can gain valuable insights into market conditions and take advantage of profitable trading opportunities.
To trade with the RSI indicator successfully, you follow these key strategies:
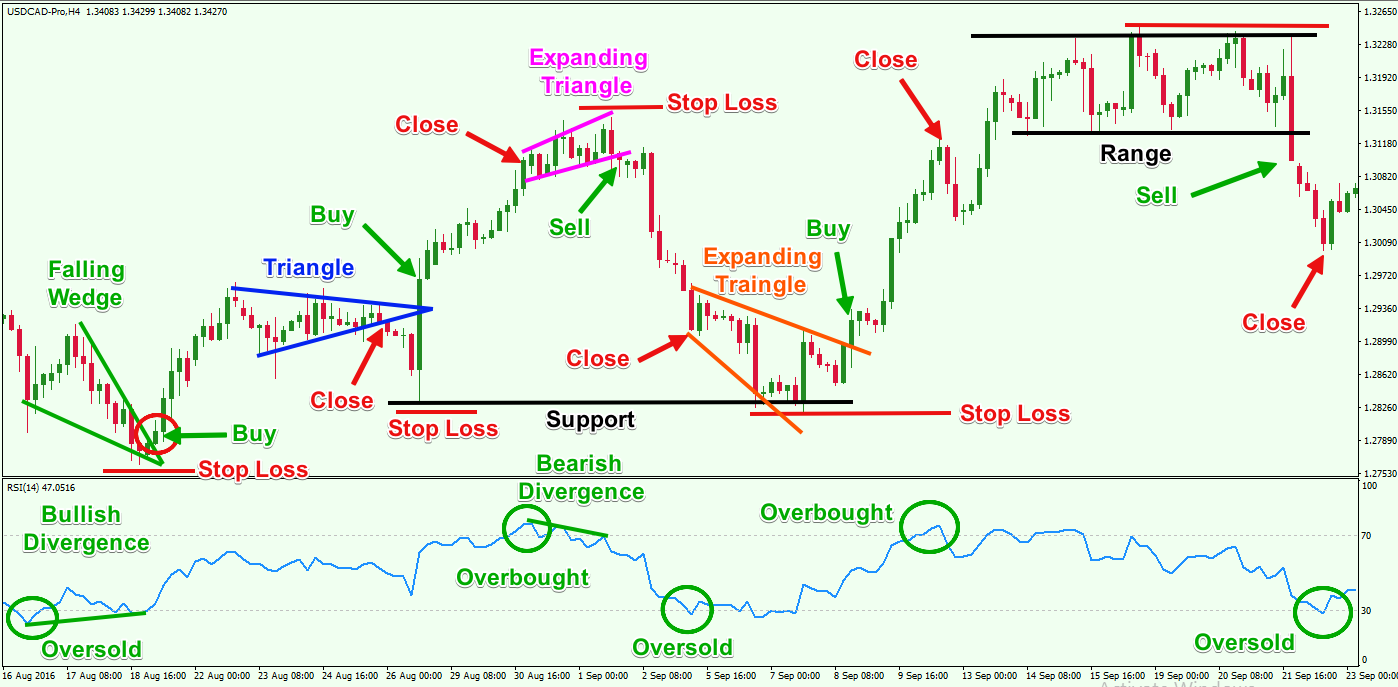
- Identify overbought and oversold levels: The RSI provides readings between 0 and 100, where values above 70 indicate overbought conditions and values below 30 indicate oversold conditions. When the RSI reaches extreme levels, it suggests a potential reversal is imminent.
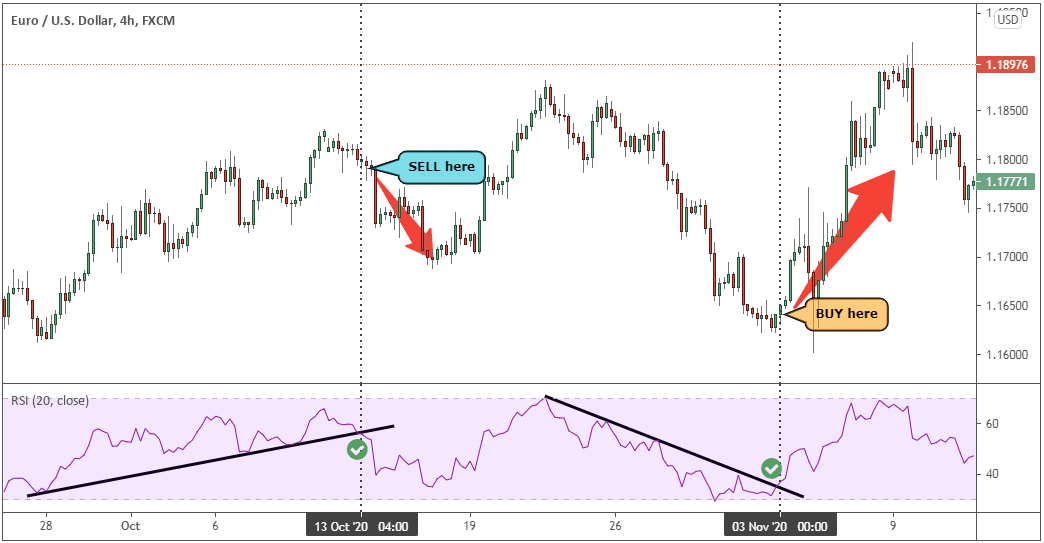
- Look for divergences: Divergence occurs when the price moves in one direction while the RSI moves in the opposite direction. This discrepancy often indicates a weakening trend and can be a powerful signal for a reversal.
- Use trendline analysis: Drawing trendlines on the RSI chart helps you identify support and resistance levels. Breakouts above or below these lines can confirm bullish or bearish trends respectively.
- Combine with other indicators: To increase accuracy, you often use the RSI in conjunction with other technical indicators such as moving averages or volume analysis.
By understanding how to trade with the RSI indicator effectively, you can make more informed trading decisions based on its signals.
How to use RSI in Day Trading
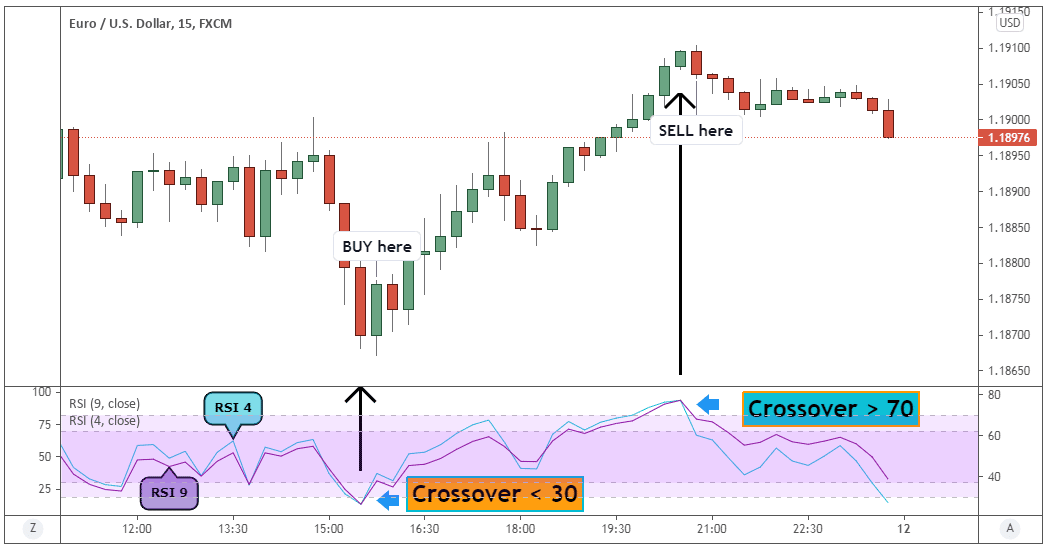
When using the RSI in day trading, it's crucial to harness its power for maximizing profit potential. One way to do this is by utilizing the RSI as a confirmation tool for entry and exit points.
For example, if the RSI indicates that a stock is overbought, with a reading above 70, it may be a signal to sell or short the stock. On the other hand, if the RSI shows that a stock is oversold, with a reading below 30, it could be an opportunity to buy or go long.
Another strategy you use with the RSI in day trading is to look for divergences between the price and the indicator. Divergence occurs when there is a disagreement between price movement and RSI readings.
For example, if a stock makes higher highs but the RSI makes lower highs, it could be an indication of weakness and a potential reversal in price. Conversely, if a stock makes lower lows but the RSI makes higher lows, it may suggest strength and an upcoming uptrend. These divergences can serve as early warning signs of potential trend changes and provide you with opportunities to take advantage of market reversals.
Frequently Asked Questions
Can the RSI indicator be used for any type of financial market, such as stocks, forex, or cryptocurrencies?
Yes, the RSI indicator can be used for any type of financial market, including stocks, forex, and cryptocurrencies. It helps identify overbought and oversold conditions, providing potential trading opportunities in various markets.
Is there a specific time frame that works best when using the RSI indicator?
There isn't a specific time frame that works best for using the RSI indicator. It depends on the trader's individual preferences and trading style. Some may prefer shorter time frames for day trading, while others may favor longer time frames for swing trading.
Are there any alternative indicators or tools that can be used with the RSI to improve trading strategies?
Yes, there are several alternative indicators and tools that can be used with RSI to enhance trading strategies. Some popular ones include MACD, Bollinger Bands, and Stochastic Oscillator. These can provide additional confirmation or complementary signals for better decision-making.
What are some common mistakes or pitfalls to avoid when using the RSI indicator?
Some common mistakes to avoid when using the RSI indicator include relying solely on it without considering other factors, using a fixed threshold for overbought or oversold conditions, and not adapting the strategy to different market conditions.
Can the RSI indicator be used for long-term investing or is it primarily suited for short-term trading?
The RSI indicator can be used for both long-term investing and short-term trading. It provides valuable insights into the market's overbought or oversold conditions, helping me make informed decisions regardless of my investment horizon.
Conclusion
The RSI strategies are very helpful for traders looking to identify potential overbought or oversold conditions in the market. By implementing the appropriate settings, such as the time period and overbought/oversold levels, traders can fine-tune their strategy to match their specific trading style.

