In this article, Forex Prop Reviews will dive deep into the world of candlestick pattern strategies to enhance our trading skills and improve our chances of success.
7+ Candlestick Patterns Strategies for Forex
Candlestick patterns are an essential tool in my trading arsenal. These formations on price charts provide valuable insights into market sentiment and can help me identify potential trend reversals or continuations.
By understanding and utilizing candlestick patterns effectively, I can develop strategies that give me a competitive edge in the financial markets.
In this article, Forex Prop Reviews will explore some of the most powerful candlestick patterns strategies.
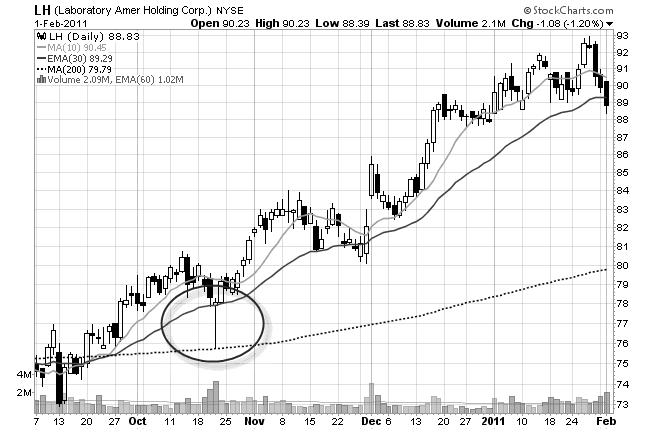
Pin Bar Reversals Patterns
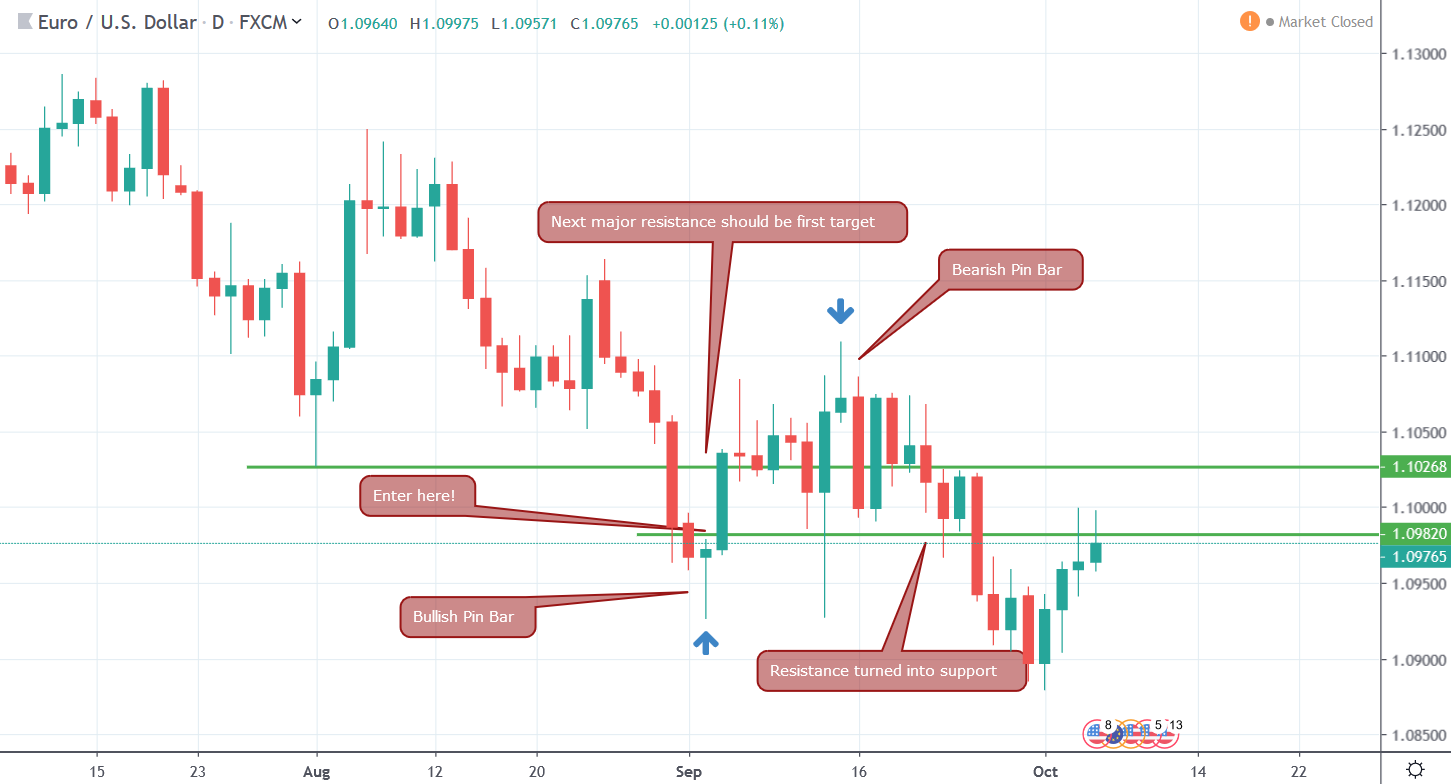
The pin bar reversal pattern is like a sudden flash of lightning, signaling a potential change in the market direction. It's one of the most widely recognized candlestick pattern strategies used in technical analysis strategies.
The pin bar consists of a long wick or shadow, which represents the rejection of price at a certain level, and a small body located opposite the wick. When this pattern forms after an uptrend or downtrend, it suggests that the market sentiment may be shifting.
Bullish and Bearish Engulfing Patterns
Start by looking out for bullish and bearish engulfing patterns, as they can be incredibly enjoyable to spot and can provide valuable insights into market trends.
A bullish engulfing pattern occurs when a small bearish candle is followed by a larger bullish candle that completely engulfs the previous candle. This pattern suggests that buyers have taken control of the market and there may be a potential upward trend reversal.
On the other hand, a bearish engulfing pattern is the opposite, where a small bullish candle is followed by a larger bearish candle that engulfs it completely. This indicates that sellers have taken over and there might be a potential downward reversal in the market.
These patterns are significant because they show strong shifts in market sentiment. When you spot a bullish engulfing pattern, it could be an indication to go long or buy, while a bearish engulfing pattern may signal an opportunity to go short or sell.
It's important to wait for confirmation after spotting these patterns, such as seeing higher highs and higher lows in subsequent candles for bullish engulfing patterns or lower highs and lower lows for bearish engulfing patterns.
Inside Bars for Reversals and Continuations
To truly understand market trends and make informed decisions, you need to keep an eye out for inside bars - these hidden gems can reveal potential reversals or continuations that could greatly impact your trading journey.
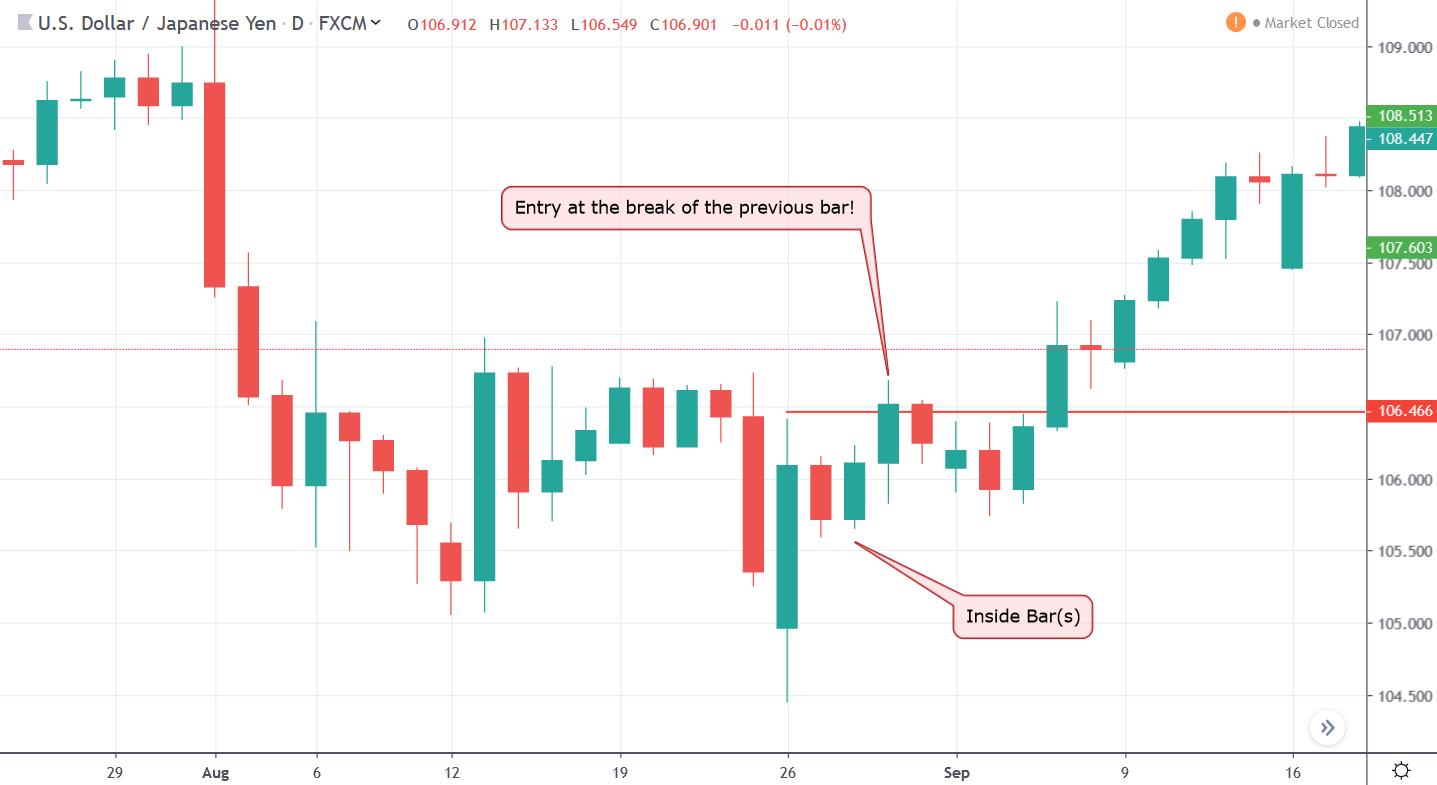
Inside bars are candlestick patterns that form when the high and low of the current candlestick are within the range of the previous candlestick. This indicates a period of consolidation or indecision in the market.
When analyzing inside bars, there are several key factors to consider:
- The size of the inside bar compared to the previous bar: A smaller inside bar suggests a tighter consolidation and potentially stronger breakout.
- The location of the inside bar: If it forms near support or resistance levels, it can signal a potential reversal.
- The volume during the formation of the inside bar: Higher volume can indicate increased interest and a higher probability of a breakout.
- The direction of the trend prior to the formation of the inside bar: If it aligns with the overall trend, it suggests a continuation pattern; if it goes against the trend, it may indicate a reversal.
- Confirmation through price action: Waiting for confirmation through subsequent price movement can increase reliability.
By incorporating these considerations into your analysis, you can effectively identify potential reversals or continuations using inside bars.
You can learn more about another technical analysis strategy in this article "Fibonacci Retracement Strategies"
Doji Bars Signal Indecision
When analyzing inside bars, you need to pay attention to doji bars as they signal a state of indecision in the market. Doji bars are characterized by their small bodies and long upper and lower wicks, indicating that there is an equal balance between buyers and sellers. This means that neither side has enough strength to push the price significantly higher or lower.
As a trader, this information is crucial because it suggests that a potential reversal or continuation could occur in the near future. Doji bars provide valuable insight into market sentiment. They indicate that traders are uncertain about the direction of the market, leading to a pause in price action.
It's important to note that not all doji bars will result in a reversal or continuation pattern, but they serve as an early warning sign for potential changes in trend. By identifying these doji bars within inside bar formations, you can anticipate possible shifts in momentum and adjust your trading strategy accordingly.
Three Bar Reversal Patterns
As a trader, you can spot potential trend reversals by recognizing three bar reversal patterns. These patterns consist of three consecutive bars that indicate a shift in market sentiment. The first bar is typically an up or down bar indicating the current trend.
The second bar is the reversal bar, which shows a change in direction from the previous trend. Finally, the third bar confirms the reversal by closing in the opposite direction of the first bar.
Three bar reversal patterns can be bullish or bearish depending on the context. For example, a bullish three-bar reversal pattern occurs when there is a downtrend followed by a lower low and higher high forming a small range within the previous candle's body. This signals that buyers are stepping in and reversing the downward momentum.
On the other hand, a bearish three-bar reversal pattern happens when there is an uptrend followed by a higher high and lower low forming another small range within the previous candle's body. This indicates that sellers are taking control and pushing prices lower.
Recognizing three bar reversal patterns is essential for traders to identify potential trend reversals in financial markets. By understanding these patterns and their implications, you can make informed decisions about your trading strategies.
Hanging Man Signals Bearish Reversal
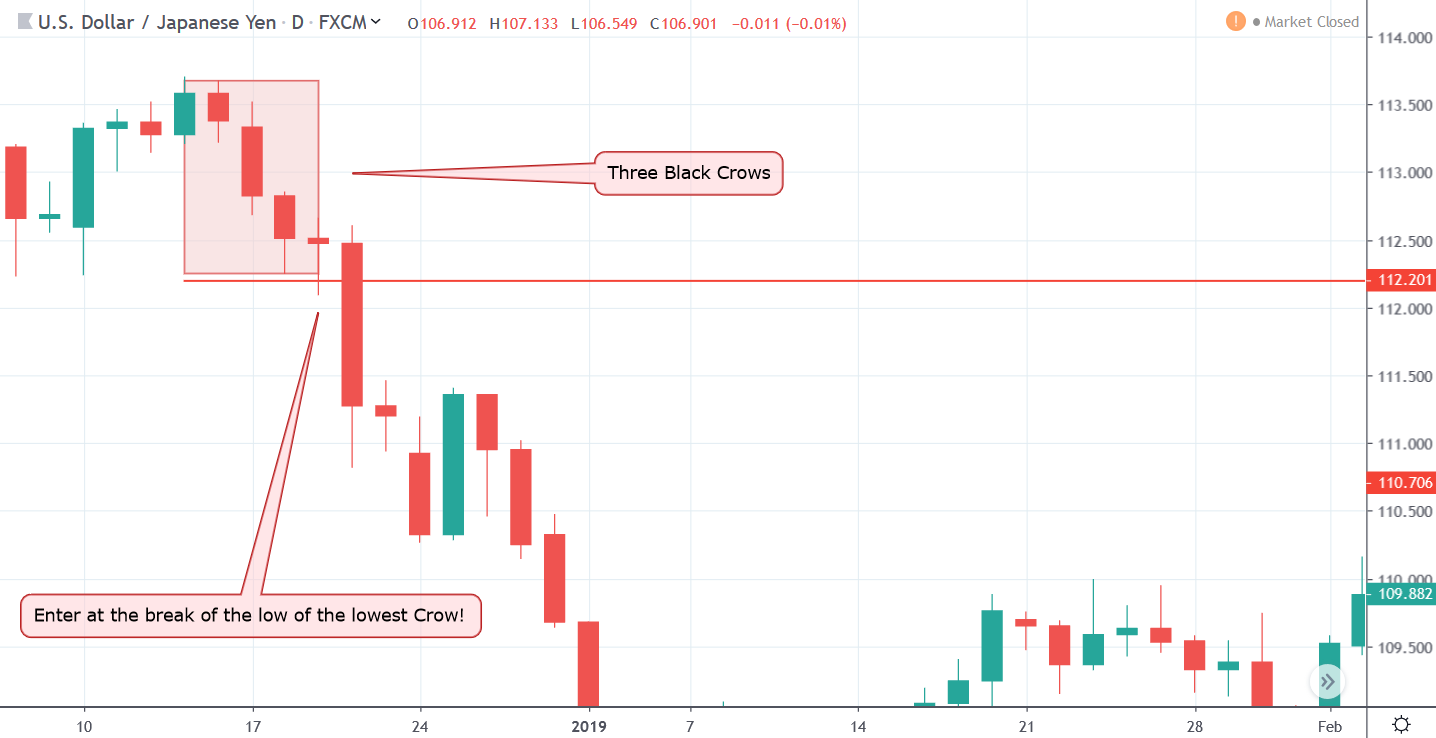
Get ready to witness the power of a hanging man as it signals a thrilling bearish reversal in the market! The hanging man is a candlestick pattern that appears after an uptrend, indicating a possible trend reversal.
It is characterized by a small body at the top of the candlestick and a long lower shadow, resembling a person hanging from a rope.
This pattern suggests that buyers were initially in control but lost momentum, allowing sellers to take over. The presence of a hanging man should alert traders to be cautious and consider taking short positions or closing long positions. It signifies that the bears are gaining strength and may push prices lower. However, it is important to wait for confirmation before making any trading decisions.
This can be done by observing subsequent candlestick formations or using additional technical indicators to validate the reversal signal provided by the hanging man.
Rising and Falling Three Methods
The rising and falling three methods create a visual representation of potential trend reversals in the market.
These candlestick patterns consist of a series of consecutive candles that provide insight into the market sentiment.
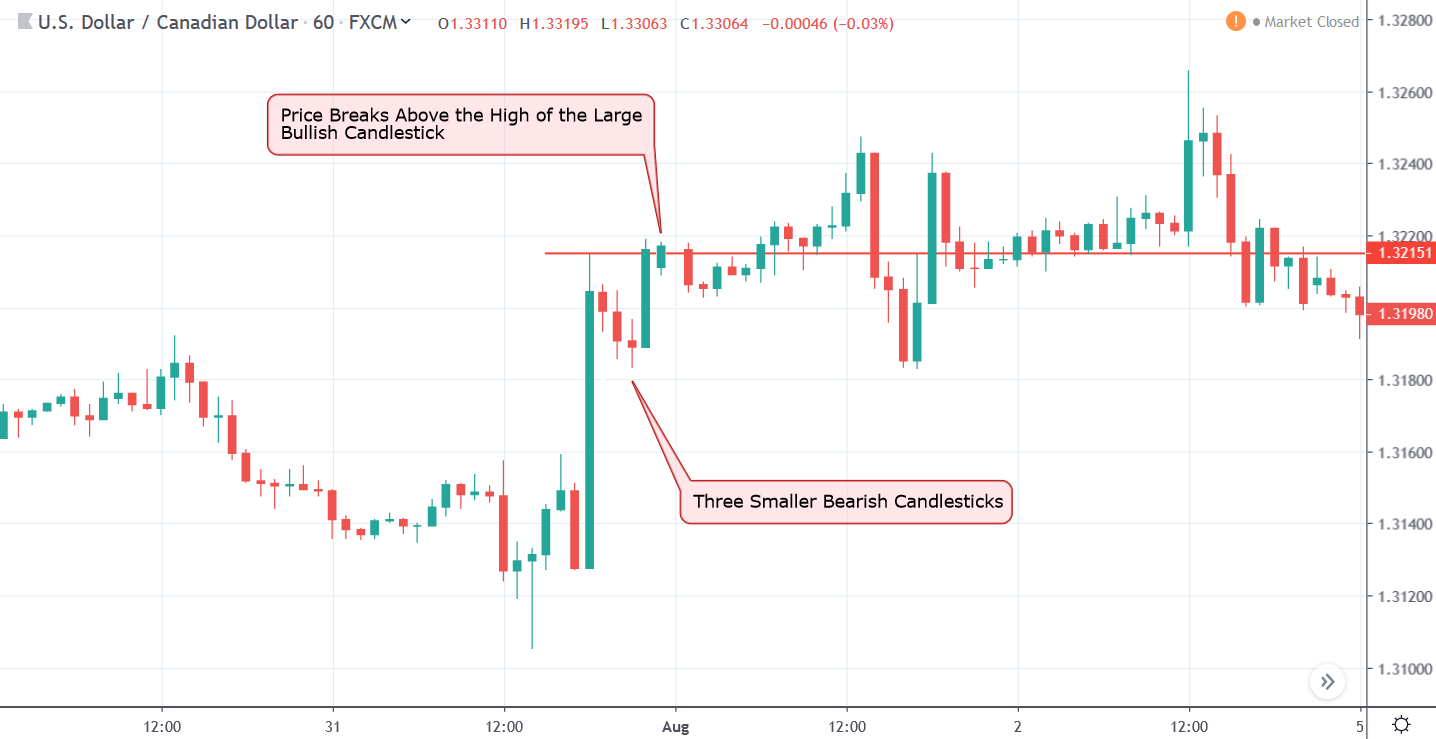
The rising three methods pattern occurs during an uptrend and consists of a long bullish candle followed by three small bearish candles, and finally another long bullish candle.
This pattern suggests that despite the temporary bearish pullback, buyers are still in control and the uptrend is likely to continue.
On the other hand, the falling three methods pattern occurs during a downtrend and follows a similar structure.
It starts with a long bearish candle, followed by three small bullish candles, and ends with another long bearish candle.
This pattern indicates that sellers are still dominant in the market despite brief bullish attempts.
It suggests that the downtrend is likely to persist.
Identifying these patterns can be valuable for traders as it provides them with insights into potential changes in market direction.
By recognizing these patterns early on, traders can take advantage of favorable entry or exit points to maximize their profits or minimize losses.
However, it is important to use these patterns in conjunction with other technical analysis tools to confirm signals before making any trading decisions.
Conclusion
Candlestick pattern strategies offer a versatile approach to analyzing the markets. They provide visual representations of market dynamics and can serve as powerful indicators for entry and exit points. Through careful observation and practice, traders can harness the power of these patterns to improve their trading performance and achieve consistent profits.

