Fibonacci Retracement Strategies can provide objective and quantifiable levels for analysis. Fibonacci retracement ratios are derived from mathematical calculations that remain constant across different time frames and markets. This consistency helps me in identifying high-probability trade setups with predefined risk-reward ratios.
Fibonacci Retracement Strategies - How to use effectively
Fibonacci Retracement Strategies have long been a staple in my trading arsenal. These strategies are based on the famous Fibonacci sequence, a mathematical concept that has found its way into various fields including finance and trading. As a trader, understanding and utilizing these strategies can provide valuable insights into potential market reversals and entry/exit points.
In this article, Forex Prop Reviews will delve into the fundamentals of Fibonacci Retracement Strategies, explaining how they work and how I personally use them in my trading approach.
What are the Fibonacci Retracement Strategies?
Fibonacci retracement strategies are a set of technical analysis strategies that traders use to identify potential levels of support and resistance in a market. These strategies are based on the mathematical sequence known as the Fibonacci sequence, which is derived from a series of numbers where each number is the sum of the two preceding ones.
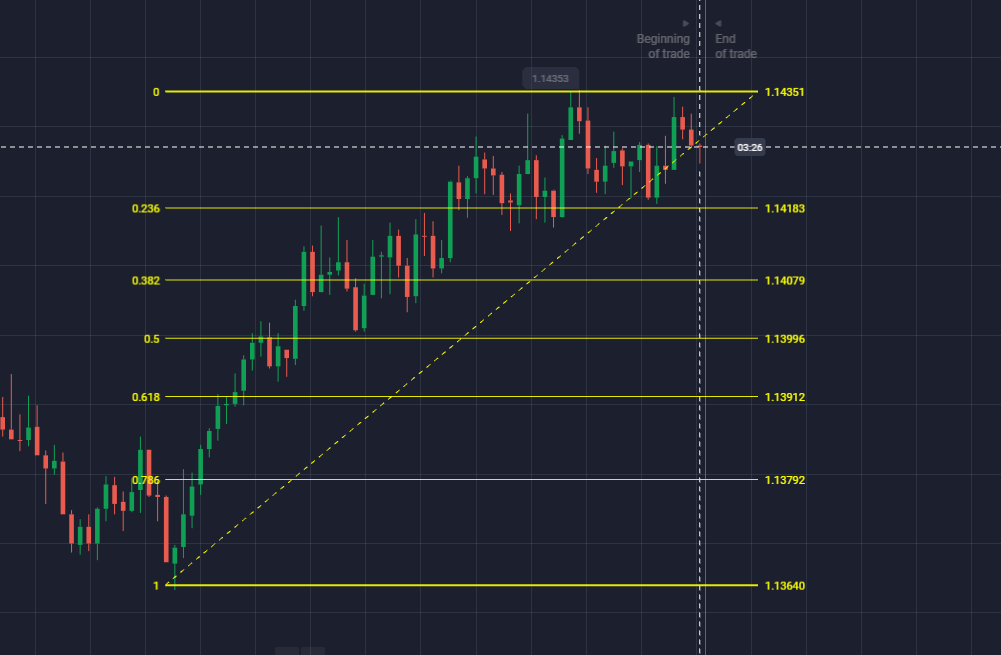
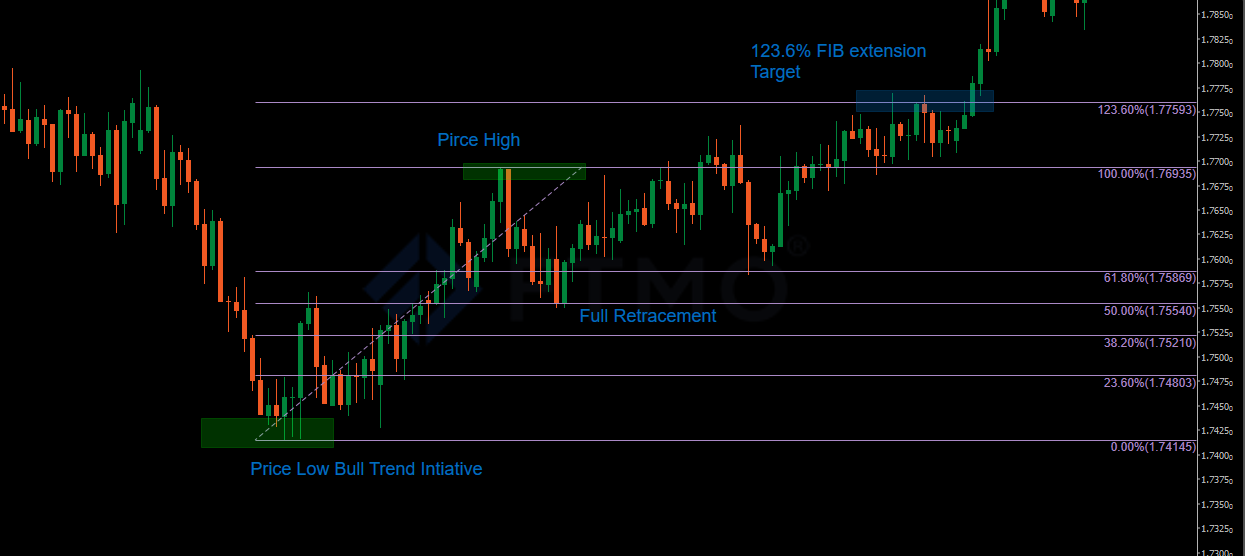
By applying these strategies, traders can plot specific levels on a price chart that indicate where potential reversals or corrections may occur. The most commonly used Fibonacci retracement levels are 38.2%, 50%, and 61.8%.
These levels are considered significant because they often coincide with key support or resistance areas in the market. Traders use these levels to anticipate price movements and make informed trading decisions.

How to use Fibonacci Retracement Levels
First, imagine yourself analyzing a stock chart and identifying key levels where the price could potentially reverse. One of the tools you can use for this analysis is Fibonacci retracement levels. These levels are based on the Fibonacci sequence, a mathematical pattern that occurs in nature and has been applied to financial markets.
By plotting these levels on a stock chart, you can identify potential areas of support or resistance where the price may bounce back or reverse.
To use Fibonacci retracement levels, you must first identify a significant swing high and swing low on the chart. The swing high is the highest point reached by the price before it starts declining, while the swing low is the lowest point reached before it starts rising again.
Once you have identified these points, you can draw horizontal lines at specific Fibonacci ratios (typically 38.2%, 50%, and 61.8%) between these two points. These lines act as potential support or resistance levels where the price may stall or reverse direction.

How to use Fibonacci Retracement Tool in MetaTrader
To effectively utilize the Fibonacci Retracement Tool in MetaTrader, you simply need to select your swing high and swing low points on the chart. Once you've done that, the tool automatically calculates and displays the crucial retracement levels for me.
This makes it incredibly easy to identify potential support and resistance levels in the market. By using these levels as a guide, you can make more informed trading decisions.
Fibonacci Forex Trading Strategies
If you want to take your forex trading to the next level and increase your chances of success, it's time to explore the powerful Fibonacci techniques that can revolutionize your approach.
Fibonacci Forex trading strategies are based on mathematical calculations that identify key market support and resistance levels. By using these levels, traders can make more informed decisions about when to enter or exit a trade.
Here are two sub-lists that highlight some popular Fibonacci Forex trading strategies:
- Fibonacci retracement: This strategy involves identifying potential areas of support or resistance by drawing horizontal lines at certain Fibonacci levels (typically 38.2%, 50%, and 61.8%) on a price chart. Traders look for price reversals or bounce at these levels as potential opportunities to enter trades.
- Fibonacci extensions: This strategy involves projecting potential price targets beyond the initial move by using Fibonacci extension levels (typically 161.8% and 261.8%). Traders use these levels to set profit targets or determine where the price may encounter significant resistance.
By incorporating these Fibonacci techniques into your forex trading strategy, you can gain a better understanding of market dynamics and improve your ability to identify high-probability trade setups.

Frequently Asked Questions
Can Fibonacci Retracement Strategies be applied to any financial market or are they specific to forex trading?
Fibonacci retracement strategies can be applied to any financial market, not just forex trading. They provide a way to identify potential support and resistance levels based on Fibonacci ratios, which are present in various markets.
Are there any limitations or drawbacks to using Fibonacci Retracement Strategies in technical analysis?
There are limitations to using Fibonacci retracement strategies in technical analysis. They are based on subjective interpretation, can be affected by market noise, and may not always accurately predict future price movements.
Can Fibonacci Retracement Levels be used as standalone indicators, or should they be combined with other technical analysis tools?
Fibonacci retracement levels should be combined with other technical analysis tools. While they can provide valuable insights, using them as standalone indicators may not provide a comprehensive picture of market trends and potential reversals.
How do Fibonacci Retracement Strategies differ from other popular technical analysis methods, such as moving averages or trend lines?
Fibonacci retracement strategies differ from other popular technical analysis methods like moving averages or trend lines because they use specific mathematical ratios to identify potential support and resistance levels in a market.
Are there any specific timeframes or chart patterns where Fibonacci Retracement Strategies tend to be more effective?
There are specific timeframes and chart patterns where Fibonacci retracement strategies tend to be more effective. These include strong trends, support and resistance levels, and clear price swings.
Conclusion
Fibonacci retracement strategies are a powerful tool in the world of trading. By applying these strategies, traders can identify potential support and resistance levels based on the key Fibonacci ratios. This allows them to make more informed decisions when it comes to entering or exiting trades.


