Ichimoku is a Japanese trading system that utilizes a range of indicators to analyze price action and forecast potential market trends. The beauty of Ichimoku strategies lies in their comprehensive nature, as they take into account multiple components and indicators to provide a holistic view of market conditions.
What is Ichimoku Strategies? How to use it?
In this article, Forex Prop Reviews will be delving into the fascinating world of Ichimoku strategies. As a trader, I have always been intrigued by the unique approach and effectiveness of these strategies in the financial markets.
By incorporating all these elements together, traders are able to gain valuable insights into market dynamics and make more informed trading decisions.
Ichimoku Trading Strategy
If you want to trade using the Ichimoku strategy, you'll need to understand its various components and how they work together. The Ichimoku strategy is one of the most popular technical analysis strategies used by traders worldwide.
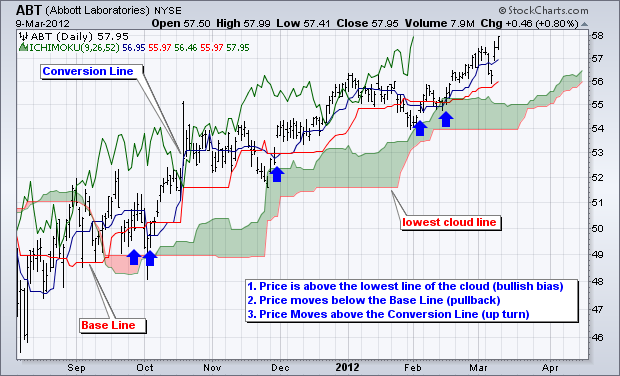
The strategy uses a combination of different indicators to identify potential trading opportunities, including the tenkan-sen (conversion line), kijun-sen (base line), senkou span A (leading span A), senkou span B (leading span B), and chikou span (lagging line).
By analyzing these components, traders can gain valuable insights into market trends, support and resistance levels, as well as potential entry and exit points.

Components and Indicators
To fully understand the potential of this trading approach, it's important to grasp the significance of its key components and indicators. The Ichimoku Trading Strategy consists of five main components: Tenkan-sen, Kijun-sen, Senkou Span A, Senkou Span B, and Chikou Span. These components work together to provide a comprehensive view of market trends and help traders make informed decisions.
The Tenkan-sen and Kijun-sen are moving averages that indicate short-term and medium-term price momentum, respectively. They can be used to identify potential entry or exit points in the market.
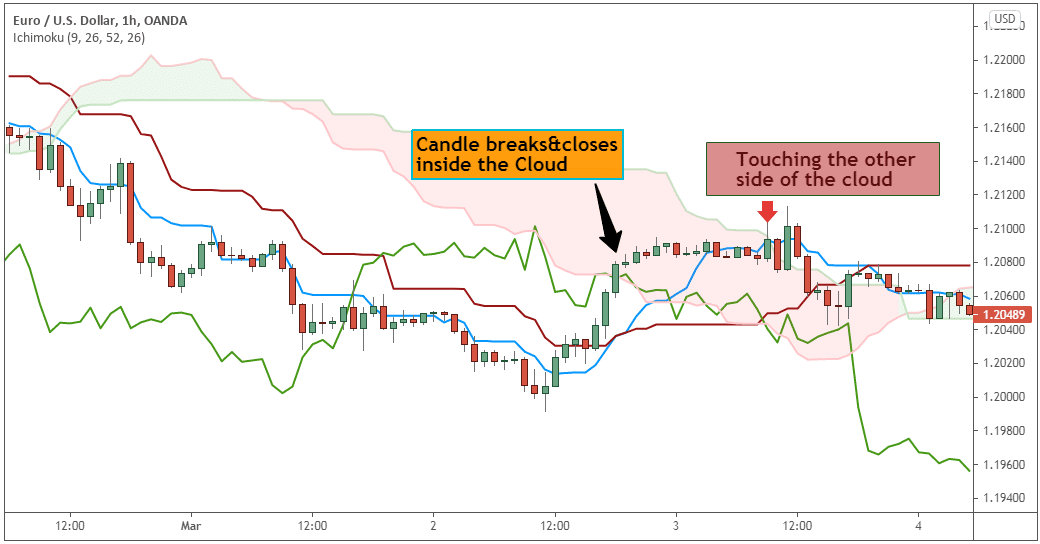
On the other hand, Senkou Span A and Senkou Span B form a cloud-like area known as the Kumo. This area represents support or resistance levels based on historical price data.
Finally, Chikou Span is a lagging indicator that plots the closing price of an asset shifted back by 26 periods. It helps confirm signals generated by other indicators.
Understanding these components is crucial for effectively interpreting Ichimoku signals and making informed trading decisions. By analyzing their interactions and relationship with price action, traders can identify potential trend reversals or continuations in the market.

Interpretation and Signals
Once you understand the components and indicators of the Ichimoku Trading Strategy, interpreting its signals becomes essential for making informed trading decisions. The Ichimoku chart provides various signals that can help identify potential market trends and reversals.
One key signal is the Tenkan-sen and Kijun-sen crossover, where the shorter-term Tenkan-sen line crosses above or below the longer-term Kijun-sen line. A bullish crossover occurs when the Tenkan-sen line crosses above the Kijun-sen line, indicating a potential upward trend.
On the other hand, a bearish crossover happens when the Tenkan-sen line crosses below the Kijun-sen line, suggesting a possible downward trend.
Another important signal is known as Senkou Span A and Senkou Span B crossover. When Senkou Span A moves above Senkou Span B, it generates a bullish signal, indicating that buyers may dominate the market. Conversely, if Senkou Span A moves below Senkou Span B, it produces a bearish signal, suggesting that sellers might have more control over price movements.
These crossovers provide valuable insights into potential trend changes and can be used to time entry or exit points in trades.

Bullish Trend
When I spot a bullish trend, it's like finding a ray of sunshine in the financial markets, signaling potential opportunities for profitable trades. It's an exciting time because I know that prices are rising and investor confidence is high.
Here are some key characteristics of a bullish trend:
- Increasing prices: In a bullish trend, prices consistently move higher over an extended period. This upward movement reflects positive market sentiment and indicates that buyers are in control.
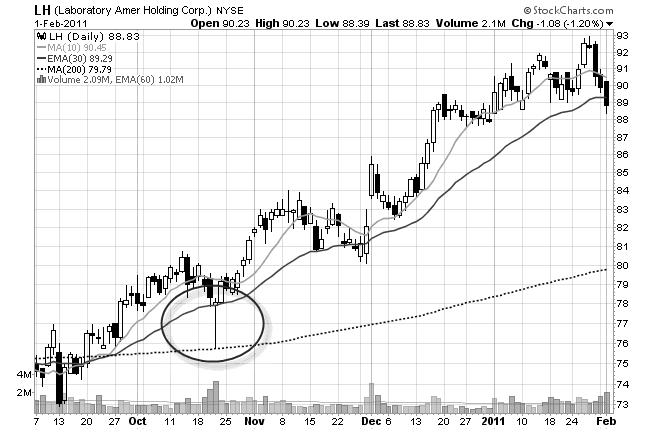
- Higher highs and higher lows: As prices rise, they create new highs and lows that are higher than previous levels. This pattern demonstrates a strong upward momentum and suggests that there is sustained demand for the asset.
- Support from technical indicators: Bullish trends often receive confirmation from technical indicators like moving averages or the Ichimoku Cloud. These tools can provide additional evidence of the strength of the trend and help me make informed trading decisions.
- Volume confirmation: Increasing trading volume during a bullish trend further validates its strength. The higher volume shows that there is significant participation from buyers, supporting the upward price movement.
- Market breadth: A broad-based rally across multiple sectors or industries indicates a healthy bullish trend. When many different stocks or assets experience simultaneous price increases, it suggests widespread optimism in the market.
When you see these signs of a bullish trend, it's essential to be prepared to take advantage of potential opportunities for profitable trades.
Application and Implementation
Implementing ichimoku strategies effectively can help traders capitalize on bullish trends and maximize their profitability in the financial markets.
One of the key aspects of applying ichimoku strategies is understanding how to interpret and use the various components of the Ichimoku cloud indicator.
By incorporating elements into my trading decisions, I can gain a deeper understanding of market sentiment, trend direction, and potential support and resistance levels.
Another critical aspect of implementing ichimoku strategies is identifying optimal entry and exit points for trades. The cloud formed by the Senkou span A and B acts as a dynamic support or resistance zone that can provide valuable insights into potential price reversals or continuations.
By waiting for prices to break above or below the cloud, you can confirm trend strength and make more informed trading decisions. Additionally, using techniques such as analyzing crossovers between the tenkan-sen and kijun-sen lines can signal potential changes in market momentum.

Conclusion
In conclusion, I've found that Ichimoku strategies can be a valuable tool for traders looking to navigate the financial markets. The components and indicators of this strategy provide a comprehensive view of market trends and help identify potential entry and exit points. By interpreting the signals generated by the Ichimoku system, traders can make informed decisions and take advantage of bullish trends.


